Mastering Workforce Strategy in 2025: The CFO’s Guide
The CFO’s Strategic Guide to Workforce Composition: A Data-Driven Analysis of Freelancers vs. FTEs
Introduction: Beyond the Budget Line Item—Workforce as a Strategic Asset
The decision to hire a full-time employee (FTE) versus engaging a freelancer is one of the most critical financial levers an agency can pull. Historically viewed through a narrow lens of immediate cost savings, this choice is, in fact, a foundational element of financial strategy. It dictates the very nature of an organization’s cost structure, shaping its resilience, scalability, and long-term profitability. The composition of a workforce is not merely a line item on a budget; it is a strategic asset that determines an agency’s capacity to navigate market volatility, absorb economic shocks, and capitalize on growth opportunities. If you want to understand more about how agencies should approach their overall financials and accounting infrastructure, see our Accounting for Marketing Agencies: A Primer for a foundational overview.
For the modern Chief Financial Officer, the dilemma is acute. On one hand, full-time employees offer stability, cultural integration, and deep institutional knowledge—invaluable assets for building a cohesive and reliable team. On the other hand, freelancers provide unparalleled flexibility, access to a global pool of specialized talent, and a variable cost model that aligns expenses directly with revenue generation. Navigating this tension requires moving beyond anecdotal evidence and gut-feel decisions. It demands a quantitative framework grounded in a granular understanding of true costs and their second-order effects on the financial health of the business.
This report provides that framework. It is designed to replace ambiguity with analysis, offering a data-driven methodology for making optimal workforce composition decisions. The analysis will proceed through five distinct stages:
- A deconstruction of the true, “fully loaded” cost of a full-time employee, moving far beyond base salary.
- A financial model of the “all-in” project cost of a freelancer, accounting for hidden management overhead.
- A direct analysis of how each labor model impacts project and agency-level profitability metrics.
- An examination of the strategic consequences for cash flow, risk management, and scalability.
- The presentation of a strategic decision matrix to guide optimal workforce planning for any given business need.
By the conclusion of this report, leaders will be equipped with a clear, defensible, and financially rigorous approach to building the most effective and profitable workforce for the future. For those leading agencies, understanding the role of accurate time tracking in service-based businesses is also essential, as labor is your most expensive and valuable resource.
I. The Anatomy of an Employee: Deconstructing the Fully Loaded Cost of an FTE

To make an informed comparison, it is imperative to first establish a precise financial baseline for the cost of a full-time employee. Gross salary represents only the visible tip of the iceberg; the true cost to the company (TCC), often referred to as the “fully loaded cost” or “labor burden,” includes a significant overlay of mandatory taxes, benefits, and overhead that can substantially increase the total expense. A widely used rule of thumb suggests that the TCC is typically 1.25 to 1.4 times the employee’s base salary. Data from the U.S. Bureau of Labor Statistics (BLS) corroborates this, indicating that in the private sector, benefits alone account for nearly 30% of an employee’s total compensation package. For accurate financial planning and a valid comparison against freelance alternatives, a detailed, line-item calculation is essential. If you find financial statements confusing or want to dive deeper, our detailed guide for agency owners can help clarify the numbers behind these cost models.
Step 1: Mandatory Employer-Paid Payroll Taxes (The Non-Negotiables)
These costs are legally mandated and represent the first layer of expense on top of gross wages. For an employer operating in California, these contributions are specific and substantial.
- Social Security: The employer is required to contribute 6.2% of an employee’s wages up to the annual Social Security wage base limit. For 2025, this cap is set at $176,100.
- Medicare: A contribution of 1.45% is required on all of an employee’s wages, with no upper limit or wage cap.
- Federal Unemployment Tax (FUTA): The standard FUTA tax rate is 6.0% on the first $7,000 of an employee’s annual wages. However, employers in states with compliant unemployment programs receive a credit of up to 5.4%, resulting in a net FUTA tax rate of 0.6%. This amounts to a maximum of $42 per employee per year.
- State Unemployment Insurance (SUI): This is a state-level tax, and in California, it is paid on the first $7,000 of an employee’s wages. The tax rate for new employers is 3.4% for the first two to three years of operation. For established employers, the rate can vary significantly, from 1.5% to 6.2%, depending on their employment history. For modeling purposes, the new employer rate of 3.4% provides a conservative baseline.
- Employment Training Tax (ETT): California employers are also subject to the ETT, which is 0.1% on the first $7,000 of wages, contributing to a state fund for worker training programs.
- Workers’ Compensation Insurance: This insurance provides benefits to employees who get injured or become ill from a work-related cause. Rates are highly dependent on the industry and the specific job classification’s risk profile. For low-risk professional roles, such as a marketing manager or software developer, a rate of approximately 1.2% of the gross salary is a reasonable estimate.
Step 2: The High Cost of Benefits (The Strategic Levers)
The benefits package is often the largest and most variable component of an employee’s TCC. While these costs are significant, they are also strategic investments in attracting and retaining top talent. The decision to offer a competitive benefits package is the primary factor that elevates an employee’s true cost from the lower end of the 1.25x multiplier toward the 1.4x range and beyond. While mandatory taxes add a predictable 8-10% to a salary, the benefits package can easily add another 15-30%. For a CFO, this means that the design of the benefits program is a primary lever for managing the overall labor burden.
- Health Insurance: This is a cornerstone of any competitive benefits package and a major financial commitment for the employer. According to the 2025 Employer Health Benefits Survey, the average annual premium for employer-sponsored family health coverage is approaching $27,000, while single coverage averages around $9,325. While employees typically contribute a portion of this premium, the employer’s share remains a substantial expense. As a reference point, California’s state employee health plans for 2025 show monthly premiums for single coverage ranging from approximately $820 to over $1,300, illustrating the significant cost even for individual plans.
- Paid Time Off (PTO): This is a direct labor cost that is frequently underestimated in financial planning. An employee with 20 days of vacation and sick leave, plus 8 paid public holidays, receives 28 days of pay without performing billable work. This equates to 224 hours in a standard 2,080-hour work year, meaning 10.8% of their salary is paid for non-productive time. This directly impacts their effective hourly cost and must be factored into calculations of their true billable rate.
- Retirement Contributions: A 401(k) plan with an employer match is a standard expectation for professional roles. A common matching formula (e.g., 50% of the employee’s contribution up to 6% of their salary) translates to an additional cost of up to 3% of the employee’s gross pay.
- Other Benefits: Additional benefits such as dental insurance, vision coverage, life insurance, and disability insurance further add to the total cost. While California’s Paid Family Leave (PFL) program is funded through the State Disability Insurance (SDI) tax, which is paid by the employee (1.2% of wages), it is still a critical part of the total compensation discussion when evaluating the attractiveness of an employment offer.
Step 3: Overhead and Ancillary Costs (The Hidden Multipliers)
Beyond taxes and benefits, a range of ancillary and overhead costs are required to recruit, onboard, and support an employee. These expenses must be allocated on a per-employee basis to arrive at a complete TCC.
- Recruitment and Onboarding: The process of finding and hiring a new employee is costly. The Society for Human Resource Management (SHRM) estimates the average cost-per-hire to be approximately $4,700. This includes expenses for job postings, recruiter time, and background checks. Once hired, the onboarding process can cost an additional $1,000 to $5,000 per employee, factoring in administrative time, formal training programs, and the initial period of reduced productivity as the new hire ramps up.
- Equipment and Workspace: Every employee requires a set of tools to perform their job. This includes the cost of a computer, monitors, software licenses, and other necessary hardware. Furthermore, if the employee works in an office, a portion of the facility’s rent, utilities, and office supplies must be allocated to them.
- Training and Development: To maintain a skilled and competitive workforce, ongoing investment in professional development is necessary. This typically amounts to 1-3% of an organization’s total payroll annually.
To crystallize these components into a tangible figure, the following table provides a line-item breakdown of the fully loaded annual cost for a hypothetical Marketing Manager in California with a base salary of $84,000 per year ($7,000 per month).
Table 1: Fully Loaded Annual Cost of a Full-Time Employee (California Marketing Manager Example)
| Cost Component | Calculation Basis | Annual Cost |
|---|---|---|
| Base Salary | — | $84,000.00 |
| Social Security | 6.2% of $84,000 | $5,208.00 |
| Medicare | 1.45% of $84,000 | $1,218.00 |
| FUTA | 0.6% of first $7,000 | $42.00 |
| California SUI | 3.4% of first $7,000 | $238.00 |
| California ETT | 0.1% of first $7,000 | $7.00 |
| Workers’ Compensation | 1.2% of $84,000 (low-risk role) | $1,008.00 |
| Subtotal: Mandatory Costs | $7,721.00 | |
| Health Insurance | $800/month employer contribution | $9,600.00 |
| Dental & Vision Insurance | $100/month employer contribution | $1,200.00 |
| Retirement Plan | 3% of salary (401k match) | $2,520.00 |
| Subtotal: Benefits | $13,320.00 | |
| PTO & Holidays (28 days) | ($84,000 / 260 workdays) * 28 days | $9,138.46 |
| Subtotal: Time-Off Cost | $9,138.46 | |
| Recruitment Cost | $4,700 amortized over 3 years | $1,566.67 |
| Onboarding & Training | $3,000 (1st year) + 1.5% of salary (ongoing) | $2,260.00 |
| Equipment & Software | $2,500 initial + $1,000/year | $1,833.33 |
| Office Space & Utilities | $400/month allocated cost | $4,800.00 |
| Subtotal: Ancillary & Overhead | $10,460.00 | |
| Total Annual Cost (TCC) | Sum of all costs | $124,639.46 |
| Final Cost Multiplier | TCC / Base Salary | 1.48x |
This detailed calculation demonstrates that the “1.25 to 1.4 times salary” rule of thumb can, in fact, be conservative. In this realistic scenario for a professional role in a high-cost state like California, the true cost to the company is nearly 1.5 times the employee’s base salary. This calculated, defensible number provides the necessary baseline for an accurate comparison with the freelancer model. For additional context, review how different accounting methods can affect how you see these expenditures in your financial statements.
II. The Freelancer Financial Model: Translating Rates into True Project Cost
Engaging freelancers offers a fundamentally different cost structure, one that shifts a significant portion of labor expense from a fixed to a variable category. However, a common mistake in financial analysis is to assume that a freelancer’s quoted rate represents their total cost. Freelancers are not simply “cheaper”; their pricing is structured to cover the very costs—taxes, benefits, equipment, and non-billable administrative time—that an employer covers for an FTE. A rigorous analysis requires translating their rates into a true, “all-in” project cost by accounting for the internal resources required to manage them effectively.
Understanding Freelancer Pricing Structures
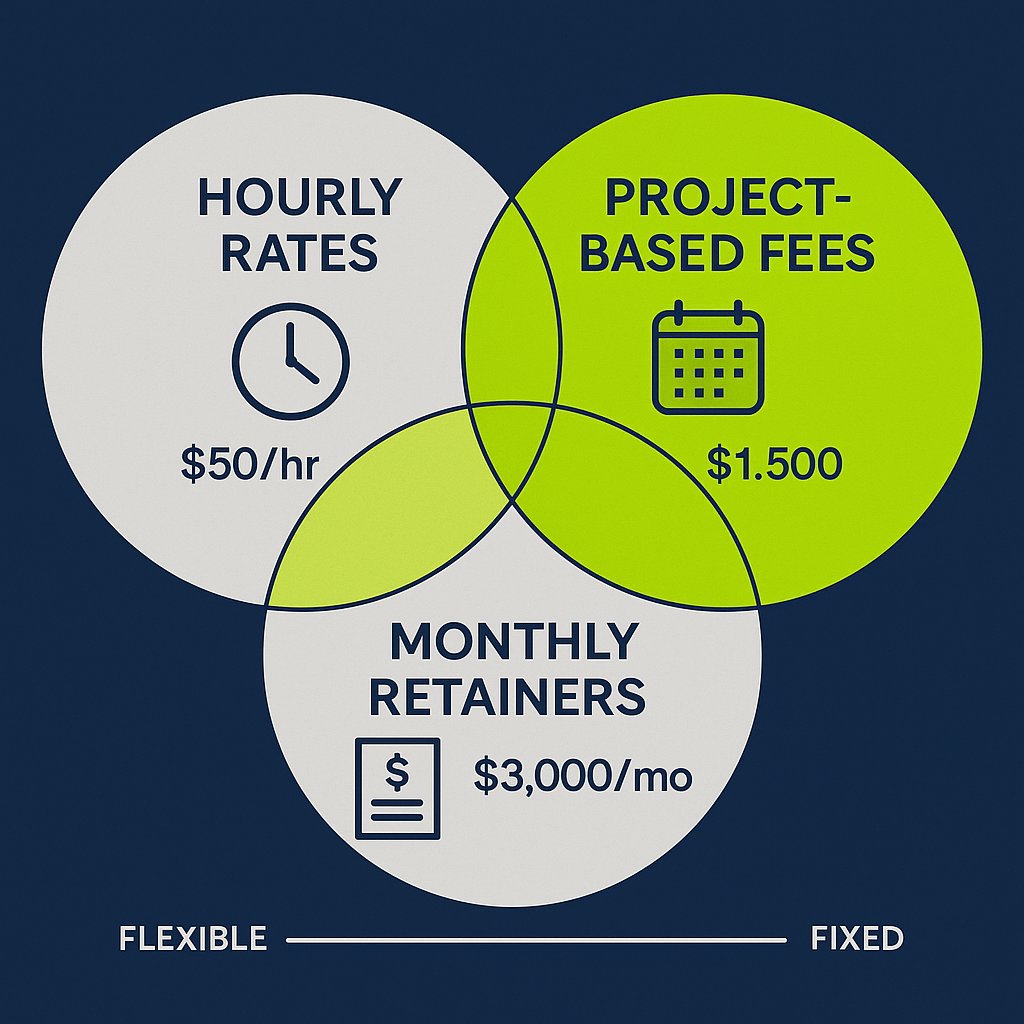
- Hourly Rates: This is the most direct pricing model, where the agency pays for the time spent on a task. Rates for marketing and creative roles vary significantly based on experience, specialization, and geographic market. A general breakdown for 2025 shows:
- Entry-Level (0-2 years): $25 – $50 per hour.
- Mid-Level (2-5 years): $50 – $120 per hour.
- Expert (5+ years): $120+ per hour, with highly specialized consultants commanding significantly more. For instance, a freelance Digital Marketing Consultant averages around $82 per hour, while a Market Research specialist may charge $77 per hour.
- Project-Based Fees: This model provides cost certainty for the client by establishing a flat fee for a well-defined scope of work. This shifts the risk of inefficiency from the agency to the freelancer. Examples include a $3,000 fee for a website copywriting project or a $7,500 fee for a three-month SEO campaign. This model allows an agency to perfectly align a specific cost with a specific revenue stream, creating highly predictable project-level margins.
- Monthly Retainers: For ongoing needs, a monthly retainer ensures consistent access to a freelancer’s services for a fixed fee. This model is common for services like social media management, content marketing, or SEO maintenance. Retainers can range from $1,000 per month for basic services to over $10,000 per month for comprehensive, strategic support. This structure offers a middle ground between the variability of hourly work and the fixed commitment of an FTE, creating predictable monthly costs that can be more easily integrated into financial forecasts. The optionality provided by these different pricing models is a strategic tool for a CFO, enabling the construction of a more flexible and resilient cost structure that improves cash flow management. If you’re interested in how agencies address the challenges of in-house vs. outsourced accounting, see our comparison of accounting outsourcing models.
Calculating the “All-In” Freelancer Cost
The freelancer’s invoice is only part of the total cost equation. To create a true “apples-to-apples” comparison with an FTE’s fully loaded cost, the agency must quantify and add the internal costs associated with managing that external resource.
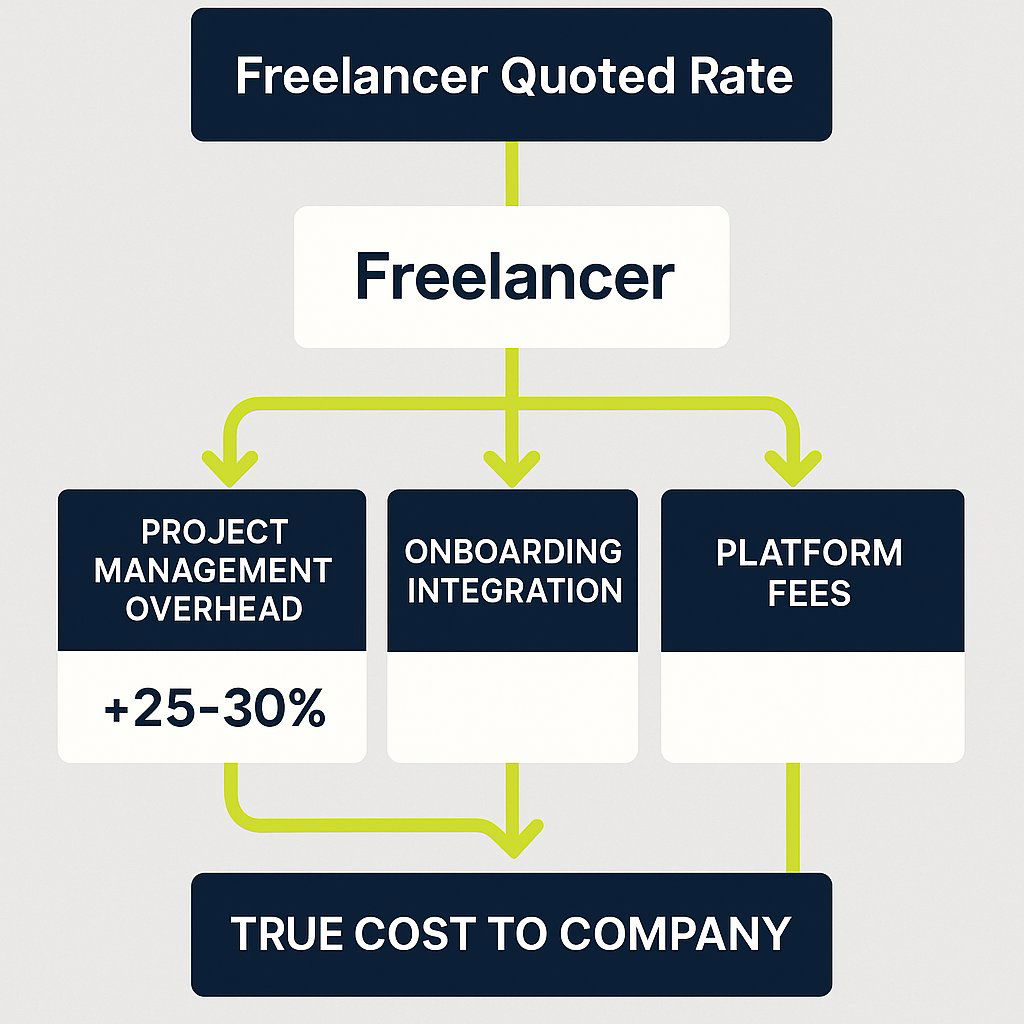
- The Project Management (PM) Overhead: This is the most critical, and most frequently overlooked, indirect cost of using freelancers. An agency’s full-time staff must invest time in sourcing, vetting, briefing, managing, providing feedback, and integrating the freelancer’s work into the final client deliverable. This internal time is not free. A key industry guideline for maintaining profitability suggests that an agency should add a markup of 25-30% to a freelancer’s direct cost to account for this internal project management and client service time. This PM overhead is a necessary component of the true cost calculation.
- Onboarding and Integration Costs: While significantly less intensive than for an FTE, there is still a non-zero cost associated with bringing a new freelancer into the fold. This includes the time spent on contract negotiation, system access setup (e.g., to project management software or communication channels), and initial briefing on agency standards and client-specific requirements.
- Platform Fees: When sourcing talent through freelance platforms like Upwork or Fiverr, the agency must account for service or commission fees. These fees can range from 5% to 20% of the transaction value. Often, experienced freelancers will build this platform fee into their quoted rate, meaning the agency ultimately bears the cost.
This leads to a crucial concept for accurate financial comparison: the ‘Freelancer Burden Rate’. Just as an FTE’s salary is augmented by a “burden rate” of taxes and benefits, a freelancer’s quoted rate must be augmented by an internal “burden rate” of management and integration costs. A simple comparison of a freelancer’s $100 per hour rate to an FTE’s salary-derived hourly rate is a dangerously misleading oversimplification. By applying the 25-30% PM overhead guideline, that $100 per hour freelancer effectively costs the agency $125-$130 per hour in total allocated resources. This intellectually honest financial model prevents the chronic underestimation of the true cost of leveraging external talent. It fundamentally reframes the strategic question from “Who has a lower hourly rate?” to the more accurate and meaningful question, “What is the total cost to the company to complete this specific scope of work?”
III. The Profitability Matrix: A CFO’s Guide to Labor ROI
With a clear understanding of the true costs of both FTEs and freelancers, the analysis can now shift to the analytical core of the issue: how does the choice between them directly impact project and agency-level profitability? This requires moving beyond simple cost comparison to an examination of labor efficiency and its effect on the most critical metric for any service-based business. If you’ve ever wondered how time tracking supports not just project delivery, but your firm’s financial results and decision-making, explore our guide on strategic time tracking for agencies.
Introducing Gross Margin
For a service business where the “cost of goods sold” is primarily the cost of the people delivering the service, the single most important profitability metric is Gross Margin. It is a direct measure of how efficiently the agency converts revenue into profit before accounting for overhead (sales, general, and administrative expenses). It is calculated as:
Gross Margin = Agency Net Revenue – Direct Expenses / Agency Net Revenue
Where Agency Net Revenue is total revenue minus any pass-through costs (like ad spend or printing), and Direct Expenses are the direct costs of the people and tools required to fulfill the client work. This is where both the fully loaded cost of FTEs and the all-in cost of freelancers reside. A healthy, sustainable agency should target an overall Gross Margin of 50% or higher. To achieve this agency-wide goal, individual project margins must be even higher, ideally in the 60-70% range, to ensure there is sufficient gross profit to cover overhead and still yield a healthy net profit.
The Foundational Rules of Agency Profitability
To consistently achieve these target margins, two foundational pricing and costing rules are essential:
- The Freelancer 2x Rule: To maintain a healthy 50% Gross Margin on work performed by a freelancer, the agency must charge the end client at least double what it pays the freelancer. For example, if a freelancer is paid $5,000 for a project component, the agency must bill the client at least $10,000 for that same component.
- The Employee 3x-4x Rule: An employee’s billable work must generate revenue that is three to four times their direct salary cost. This larger multiplier is necessary to cover not only their salary but also their fully loaded cost (the ~1.5x TCC calculated earlier) and their share of agency overhead, while also accounting for the fact that they are not 100% billable.
Utilization Rate: The Great Equalizer
The concept of non-billable time leads directly to the most critical variable in comparing the profitability of FTEs and freelancers: the utilization rate. This metric is defined as the percentage of an employee’s total paid hours that are spent on direct, billable client work. Reaching a 100% utilization rate for an FTE is impossible. A significant portion of their time is consumed by non-billable (but necessary) activities such as internal meetings, administrative tasks, training, business development, and paid time off. A realistic and often ambitious target for a delivery-focused employee is a utilization rate of 70-80%. If untracked admin and non-billable time are draining your agency profits, read about how to stop the silent profit leak by making operational costs visible.
This stands in stark contrast to the freelancer model. When a freelancer is engaged for a specific project and bills on an hourly or project basis, they are, by definition, 100% utilized for the hours billed to that project. The agency pays only for productive, billable output. This fundamental difference in utilization is the primary reason why a higher-priced freelancer can often be significantly more profitable than a seemingly lower-cost full-time employee on a project-by-project basis.
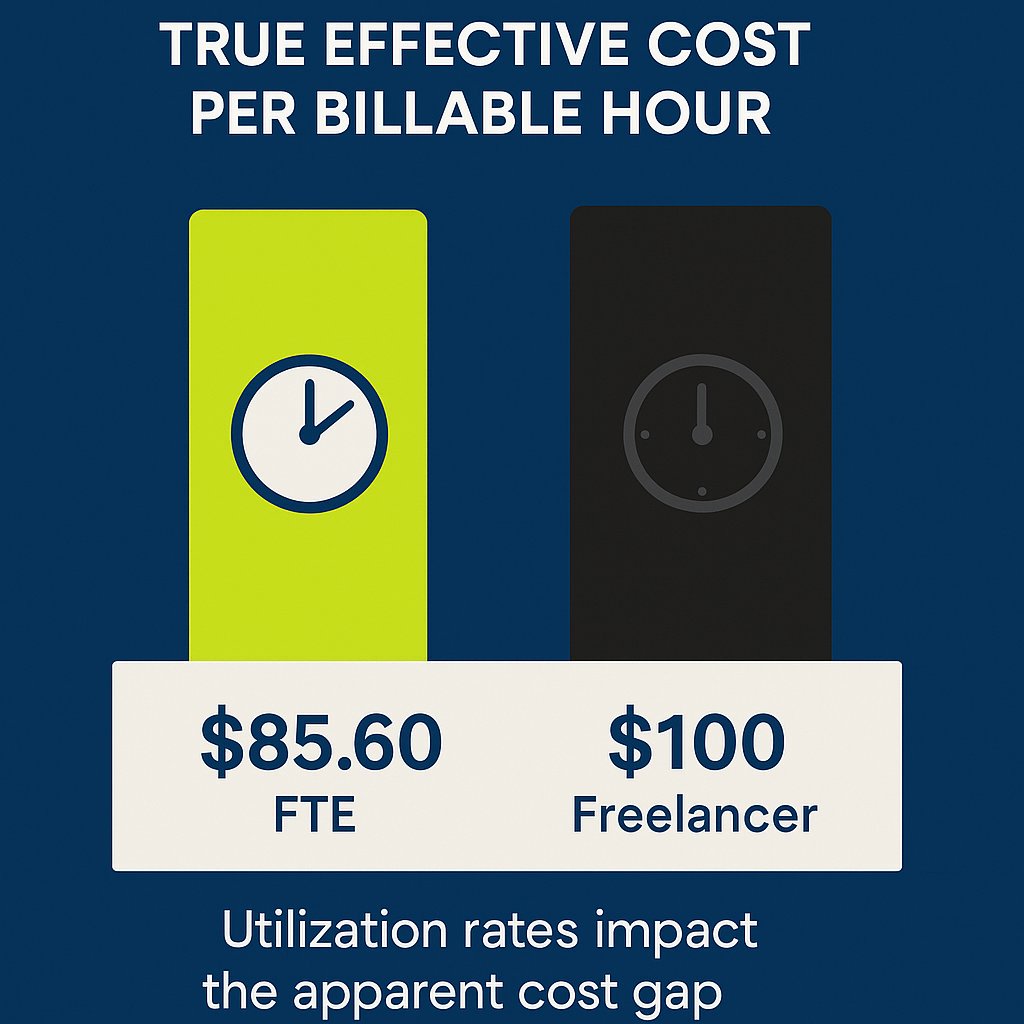
To illustrate this, consider the FTE from Section I. Their fully loaded annual cost (TCC) was calculated to be $124,639.46. Based on a standard 2,080-hour work year, their fully loaded cost per hour is approximately $59.92. However, this is their cost for every hour the agency pays for, whether billable or not. If that employee has a billable utilization rate of 70%, the agency’s true cost for each billable hour they produce is significantly higher. The calculation is:
Effective Cost per Billable Hour = Fully Loaded Cost per Hour / Utilization Rate
This $85.60 figure is the correct number to use when calculating project-level profitability for work done by this FTE. It represents the true cost to the agency of getting one hour of billable work from this employee. When this is compared to a senior freelancer who charges $100 per hour, the cost difference is no longer as dramatic as a simple comparison of salary to the freelance rate would suggest. The gap has narrowed considerably because the freelancer’s rate has internalized their non-billable time, while the FTE’s cost of non-billable time is an expense borne by the agency.
The following table provides a tangible, numerical demonstration of this dynamic, modeling the profitability of a hypothetical project staffed by an FTE versus a freelancer.
Table 2: Comparative Profitability Analysis: FTE vs. Freelancer on a $50,000 Project
| Metric | Staffed by FTE | Staffed by Freelancer |
|---|---|---|
| Project Revenue | $50,000.00 | $50,000.00 |
| Required Billable Hours | 250 | 250 |
| Agency Billable Rate | $200.00/hour | $200.00/hour |
| Effective Cost per Billable Hour | $85.60 | $100.00 |
| Total Labor Cost for Project | $21,400.00 | $25,000.00 |
| Project Gross Profit | $28,600.00 | $25,000.00 |
| Project Gross Margin | 57.2% | 50.0% |
Analysis:
At first glance, the FTE appears to be the more profitable option for this specific project, yielding a higher Gross Margin of 57.2% compared to the freelancer’s 50.0%. However, this analysis is incomplete without considering the broader context. The freelancer model guarantees that 100% of the $25,000 labor cost is directly tied to this $50,000 revenue stream. The cost is incurred if and only if the project exists.
For the FTE, the agency still incurs the full cost of their un-utilized time. The 30% of their hours that are not billed to this project (or any other) represent a fixed, unrecoverable cost that drags down overall agency profitability. If there is not enough billable work to keep the FTE at their 70% utilization target, their effective cost per billable hour skyrockets, and agency profits suffer. The freelancer model completely eliminates the financial risk of paying for this “idle time.” Therefore, while an FTE might be more profitable on a fully utilized project, the freelancer presents a more resilient and less risky cost structure, particularly in an environment of fluctuating client demand.
IV. The Strategic Impact on Scalability and Cash Flow
The decision between FTEs and freelancers extends far beyond project-level profitability calculations. It has profound, second-order effects on an agency’s long-term financial strategy, fundamentally shaping its ability to scale, manage risk, and maintain healthy cash flow. By understanding these strategic implications, a CFO can architect a workforce that not only delivers work efficiently but also enhances the financial resilience and enterprise value of the business.
From Fixed to Variable Cost Structure
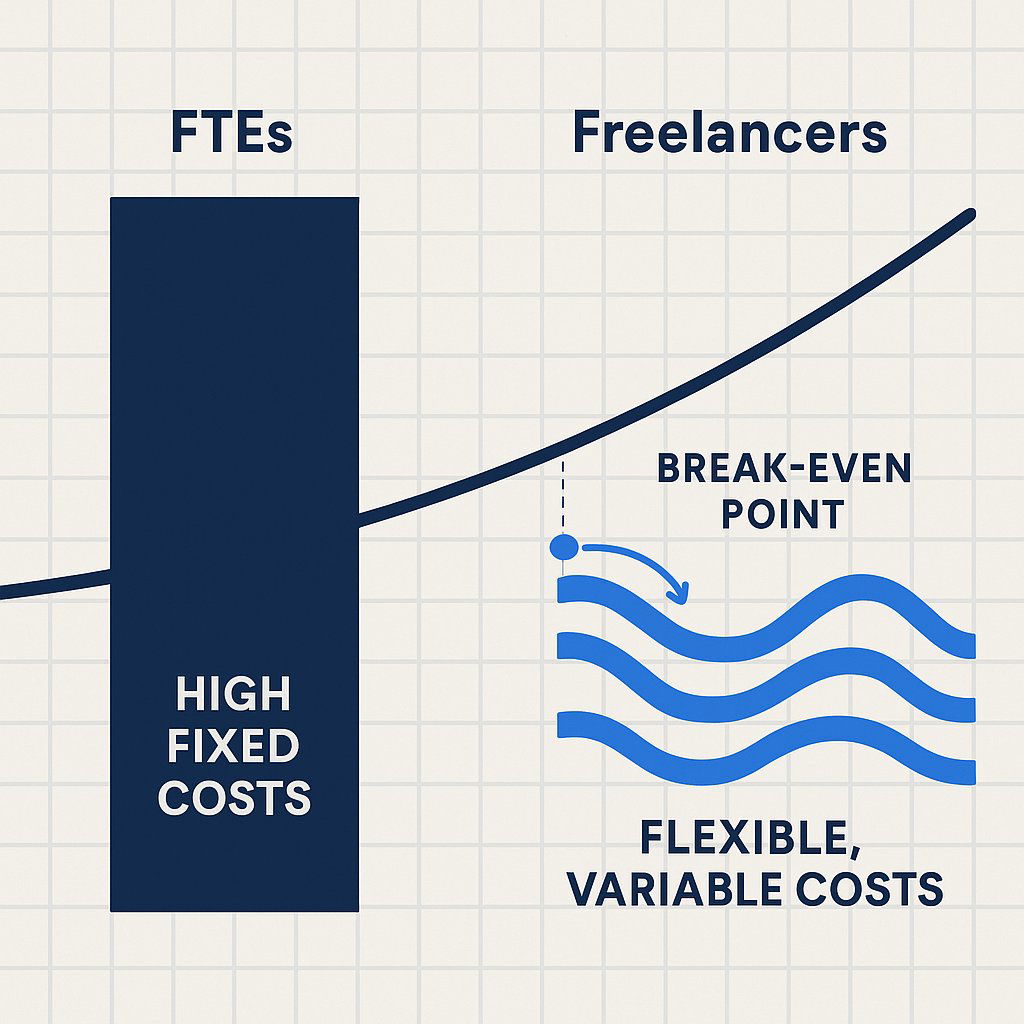
The most significant strategic difference between the two labor models lies in their impact on the agency’s operating leverage. Full-time employees, with their fixed salaries and benefits, represent a recurring, predictable cost on the profit and loss statement. This creates high operational leverage: when revenues are booming and the team is fully utilized, profits can grow at an accelerated rate. However, the inverse is also true. During economic downturns or periods of low client demand, these fixed costs persist, and losses can mount quickly.
Engaging freelancers fundamentally alters this dynamic. It allows an agency to transform a substantial portion of its largest expense category—labor—from a fixed cost into a variable cost. The cost of a freelancer is incurred only when there is revenue-generating work to be done. This direct linkage of expense to revenue is a powerful de-risking strategy, lowering the agency’s break-even point and creating a more durable financial model that is less susceptible to the natural ebbs and flows of project-based work.
Enhancing Scalability and Agility
This flexible cost structure is the engine of strategic agility and scalability. A workforce model that strategically blends a core team of FTEs with a network of on-demand freelancers provides the ability to rapidly adjust capacity in response to market opportunities and challenges.
- Scaling Up: A blended model empowers an agency to pursue and win large projects or onboard multiple new clients without the significant delay and long-term financial commitment inherent in the traditional FTE hiring process. The typical recruitment cycle for a full-time employee can be lengthy, whereas a trusted freelancer can often be engaged and start contributing within days. This model also provides immediate access to highly specialized skills—such as a GDPR compliance consultant, a mobile app developer, or a technical SEO specialist—that may be critical for a specific project but are not required on an ongoing basis, making a full-time hire financially unjustifiable.
- Scaling Down: Inevitably, agencies face periods of reduced demand, whether due to the conclusion of a major project or a broader economic slowdown. An agency with a high fixed-cost base composed primarily of FTEs faces the painful and disruptive prospect of layoffs to align costs with reduced revenue. In contrast, a variable, freelancer-centric model allows for a natural and less traumatic scaling down of costs. As project work decreases, freelancer contracts conclude, and expenses automatically contract in line with revenue, preserving margins and protecting the core business.
The Profound Impact on Cash Flow
For any service-based business, cash flow is the ultimate measure of financial health. According to SCORE, a staggering 82% of small business failures are attributable to poor cash flow management. The composition of the workforce has a direct and material impact on an agency’s ability to manage its cash effectively. To see the full spectrum of how accurate, up-to-date data supports strong cash management and decision-making, see Accurate Data in Accounting.
- Predictability and Forecasting: While FTE salaries represent a predictable monthly cash outflow, which can simplify baseline expense forecasting, this predictability comes at the cost of flexibility. Freelancer payments, which are typically tied to project milestones or monthly retainers for specific deliverables, can be more closely aligned with project-based cash inflows. When payment terms with freelancers (e.g., Net 30) are managed in concert with client invoicing schedules (e.g., 50% upfront, 50% on completion), it is possible to create a more dynamic and responsive cash flow cycle.
- Protecting the Cash Cushion: By leveraging freelancers, an agency avoids the significant and immediate cash drain associated with the full-time employment model: bi-weekly salary payments, monthly health insurance premiums, payroll tax deposits, and upfront recruitment fees. This preserves the agency’s cash reserves, which are absolutely critical for weathering unexpected financial storms, such as a major client paying late or the sudden loss of an account. A model that relies on a lean core team augmented by a flexible network of freelancers protects the financial foundation of the company by minimizing its fixed cash burn rate.
Ultimately, a blended workforce model acts as a financial shock absorber. Agency revenue is inherently volatile and project-driven. A cost structure heavy with fixed FTE salaries creates a high break-even point; when revenue dips below this threshold, the agency begins to burn through its cash reserves at an alarming rate. By shifting a significant portion of labor costs to a variable model, the break-even point is lowered. Costs naturally recede as revenues decline, protecting profitability and, most importantly, preserving cash. This demonstrated ability to maintain financial stability during downturns makes the business fundamentally less risky. For investors, lenders, and potential acquirers, this resilience and predictable cash flow are highly valuable. Therefore, the strategic composition of the workforce is not merely an operational choice; it is a key driver of the company’s long-term financial health and its overall enterprise value.
V. A Decision Framework for Optimal Workforce Composition
The analysis has demonstrated that neither the FTE nor the freelancer model is universally superior. The optimal approach lies not in a binary choice, but in the strategic blending of both to create a workforce architecture that is resilient, scalable, and profitable. This final section synthesizes the report’s findings into an actionable framework, moving beyond a simple list of pros and cons to provide a strategic tool for the agency.
Recap of Key Decision Factors
The choice for any given role or task should be evaluated against a consistent set of criteria that balance financial, operational, and strategic considerations.
- Financial: The primary financial drivers are the comparison between the fully loaded cost of an FTE and the all-in project cost of a freelancer, and the subsequent impact on Gross Margin. A critical, often overlooked, financial factor is the cost of underutilization, which is borne entirely by the agency in the FTE model.
- Operational: Key operational factors include the level of control and supervision required. FTEs allow for greater direct oversight, whereas the legal definition of an independent contractor requires a degree of autonomy in how the work is performed. Additionally, the importance of team integration, cultural contribution, and the building of institutional knowledge are significant advantages of the FTE model.
- Strategic: The strategic dimension hinges on the nature of the work itself. Is it a core, ongoing function central to the agency’s value proposition, or is it a specialized, episodic need tied to a specific project? The decision must also align with the agency’s broader strategic goals regarding scalability, market agility, and risk management.
The Four Quadrants of Workforce Planning
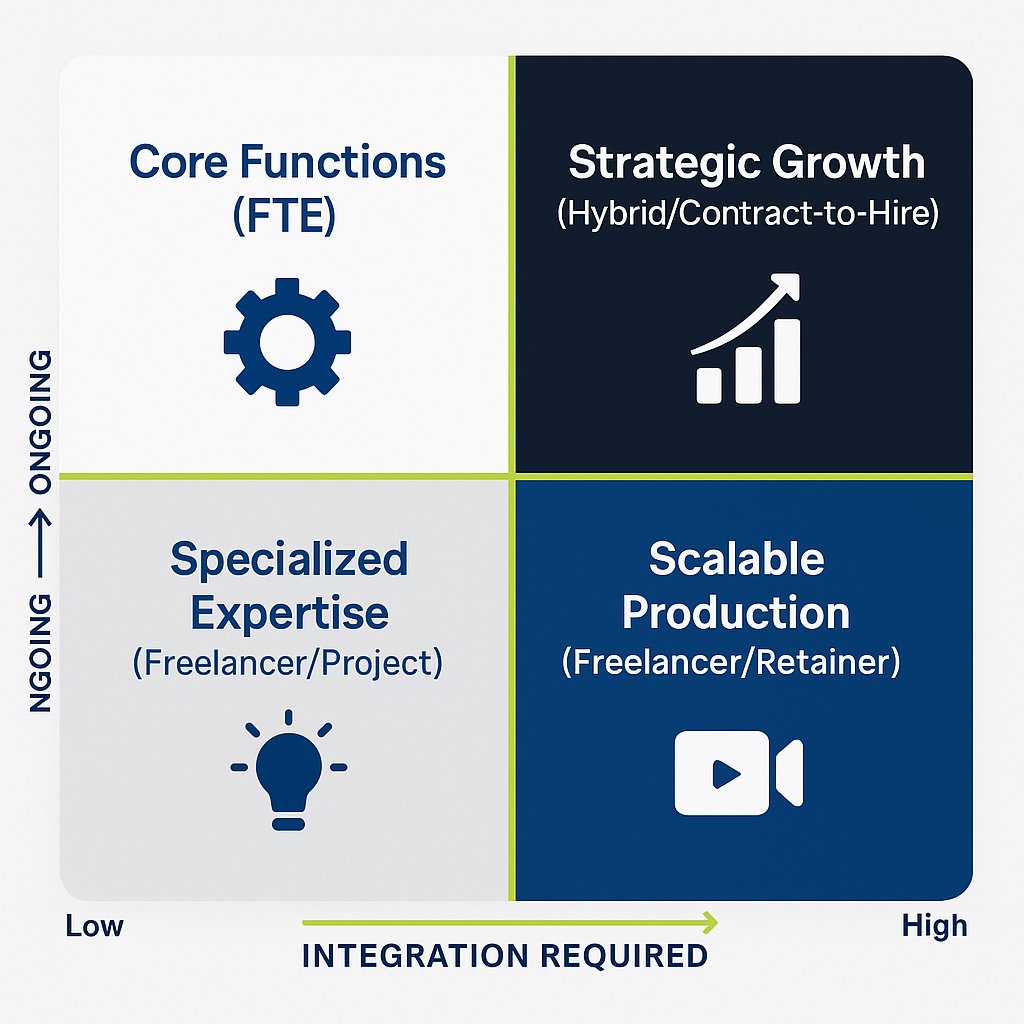
Instead of viewing the decision as a simple “either/or” choice, it is more effective to map the needs of the business onto a spectrum of workforce solutions. This can be visualized as a four-quadrant model based on the nature of the required role or task.
- Quadrant 1: Core Functions (High Integration, Ongoing Need)
- Description: These are roles that are central to the agency’s identity, daily operations, and long-term strategy. Examples include Account Directors, Creative Directors, Heads of Departments, and key operational staff (e.g., finance, HR).
- Optimal Model: Full-Time Employee (FTE).
- Rationale: These positions require deep institutional knowledge, consistent availability for leadership and team management, and a strong alignment with the company’s culture and values. The stability and commitment of an FTE are paramount for these foundational roles.
- Quadrant 2: Specialized Expertise (Low Integration, Episodic Need)
- Description: This quadrant covers high-skill tasks that are critical for specific projects but are not required on a continuous, 40-hour-per-week basis. Examples include a technical SEO audit for a website launch, advanced data analytics for a research project, motion graphics for a single video campaign, or specialized legal consultation.
- Optimal Model: Freelancer (Project-Based).
- Rationale: This model provides access to world-class, niche talent without the prohibitive long-term cost of employing a high-salaried specialist who would be underutilized for much of the year. It is the most financially efficient way to inject high-value expertise precisely when and where it is needed.
- Quadrant 3: Scalable Production (Low Integration, Variable Need)
- Description: This includes production-oriented tasks where the volume of work fluctuates directly with client demand. Examples are content writing, routine graphic design, social media content creation, and pay-per-click (PPC) campaign management.
- Optimal Model: Freelancer (Retainer or Project-Based).
- Rationale: Using a flexible pool of freelance talent for these functions allows the agency to scale its delivery capacity up or down in direct proportion to its revenue pipeline. This perfectly aligns costs with revenue, protects margins, and avoids the significant financial drain of maintaining a “bench” of underutilized full-time production staff during slow periods.
- Quadrant 4: Strategic Growth Initiatives (High Integration, Project-Based Need)
- Description: This quadrant addresses the staffing needs for new, unproven initiatives, such as launching a new service line or expanding into a new market. The long-term, full-time need for a role is uncertain at the outset.
- Optimal Model: Hybrid (Contract-to-Hire).
- Rationale: This approach minimizes the initial financial risk. An agency can engage a senior professional on a long-term contract basis to pilot the initiative. This provides the necessary expertise and focus without the immediate commitment of a permanent hire. If the initiative proves successful and a continuous need is established, the contractor can then be converted to a full-time employee.
This quadrant-based approach reveals that the most financially sophisticated strategy is not a choice between FTEs and freelancers, but the intentional blending of both to create a tiered, “Core-and-Flex” labor structure. This model is built around a lean, highly-utilized core of full-time employees who manage strategy, client relationships, and core operations (Quadrant 1). This stable core is then augmented by a flexible, scalable periphery of freelance specialists and production talent that can be engaged as needed to meet fluctuating client demands (Quadrants 2 & 3). This hybrid model maximizes the distinct advantages of both employment types, creating an organization that is simultaneously stable at its core, agile at its edges, and financially efficient throughout. It is a structure designed to align costs with the natural, project-based rhythm of agency work.
To operationalize this strategy and ensure consistent decision-making across the organization, the following matrix can be used by all hiring managers.
Table 3: Strategic Hiring Decision Matrix
| Role Characteristic | Key Decision Questions | Optimal Hiring Model |
|---|---|---|
| Core Business Function | Is this role essential for daily operations and long-term strategy? Does it involve managing other employees? | FTE |
| Requires Deep Institutional Knowledge | Is deep understanding of company history, processes, and culture critical for success in this role? | FTE |
| Specialized, Episodic Skill | Is this a high-skill need for a specific, time-bound project? What is the cost of this role being underutilized? | Freelancer (Project) |
| Variable / Fluctuating Demand | Does the volume of this work change significantly from month to month based on client needs? | Freelancer (Retainer/Project) |
| New Service / Pilot Program | Is this a new initiative where the long-term, full-time need is not yet proven? What is the financial risk of a permanent hire if the initiative fails? | Contract-to-Hire |
| Need for High Control/Supervision | Does the task require constant oversight and adherence to specific internal processes? | FTE |
| Need for Rapid Scaling | Do we need to increase our capacity in this area quickly without a long recruitment cycle? | Freelancer (Retainer/Project) |
Conclusion: Building a Financially Resilient, Talent-First Agency

The analysis presented in this report leads to a clear and powerful set of conclusions. The traditional debate of freelancers versus full-time employees, when viewed through a rigorous financial lens, is revealed to be a false dichotomy. The true path to sustainable profitability and strategic agility lies not in choosing one model over the other, but in mastering the art of the blend.
The key takeaways from this investigation are threefold:
- The true cost of an employee is significantly higher than their base salary. A detailed, fully loaded cost analysis, accounting for taxes, benefits, and overhead, is non-negotiable for accurate financial planning. For a professional role in a state like California, this cost can approach 1.5 times the gross salary.
- Profitability hinges on managing the utilization gap. A freelancer’s cost is directly tied to billable output, effectively making them 100% utilized on a given project. An FTE’s cost includes a substantial portion of non-billable time, which must be covered by the margins on their productive hours. This dynamic means a higher-priced freelancer can often be the more profitable choice for discrete, project-based work.
- A flexible, variable cost structure is a profound strategic advantage. By transforming labor from a fixed to a variable expense, an agency can enhance its cash flow, reduce financial risk, and build a more scalable and resilient business model capable of thriving in a volatile market.
The final strategic recommendation is, therefore, the formal adoption of a “Core-and-Flex” workforce model. This model, guided by the principles and tools outlined in the Strategic Hiring Decision Matrix, will enable AURA to build a workforce that is both a competitive advantage in the marketplace and a cornerstone of its long-term financial health. By maintaining a lean, stable core of full-time strategic leaders and augmenting them with a flexible, on-demand network of specialized freelance talent, an agency can optimize its cost structure, protect its profitability, and position itself for sustainable, scalable growth. This is the future of agency finance: a talent-first approach built on a foundation of strategic financial resilience.
Stop the Silent Profit Leak: Unlock Agency Growth with Better Time Management
The Silent Margin Killer in Every Agency: Untracked Admin Time
That Gut Feeling Is Right: Your Agency Is Leaking Profit. Here’s Where to Find the Holes.
You’ve just closed the books on another strong quarter. Revenue is up, the client roster is growing, and your team is firing on all cylinders. But as you stare at the Profit & Loss statement, a familiar, nagging feeling creeps in. The top line looks great, but the bottom line—the actual cash left over—feels disappointingly thin. You find yourself asking the same questions every month: Where is all the money going? Why does it feel like we’re running faster just to stay in the same place?
That gut feeling is right. Your agency is likely leaking profit, but not in the way you might think. It’s not one big, obvious expense. It’s a slow, silent drain caused by thousands of tiny, unrecorded moments that add up to a significant financial hit. Profitability in a service business rarely disappears overnight; it erodes quietly through the daily grind of misaligned teams, uncontrolled scope, and the kind of rework that has become business-as-usual.
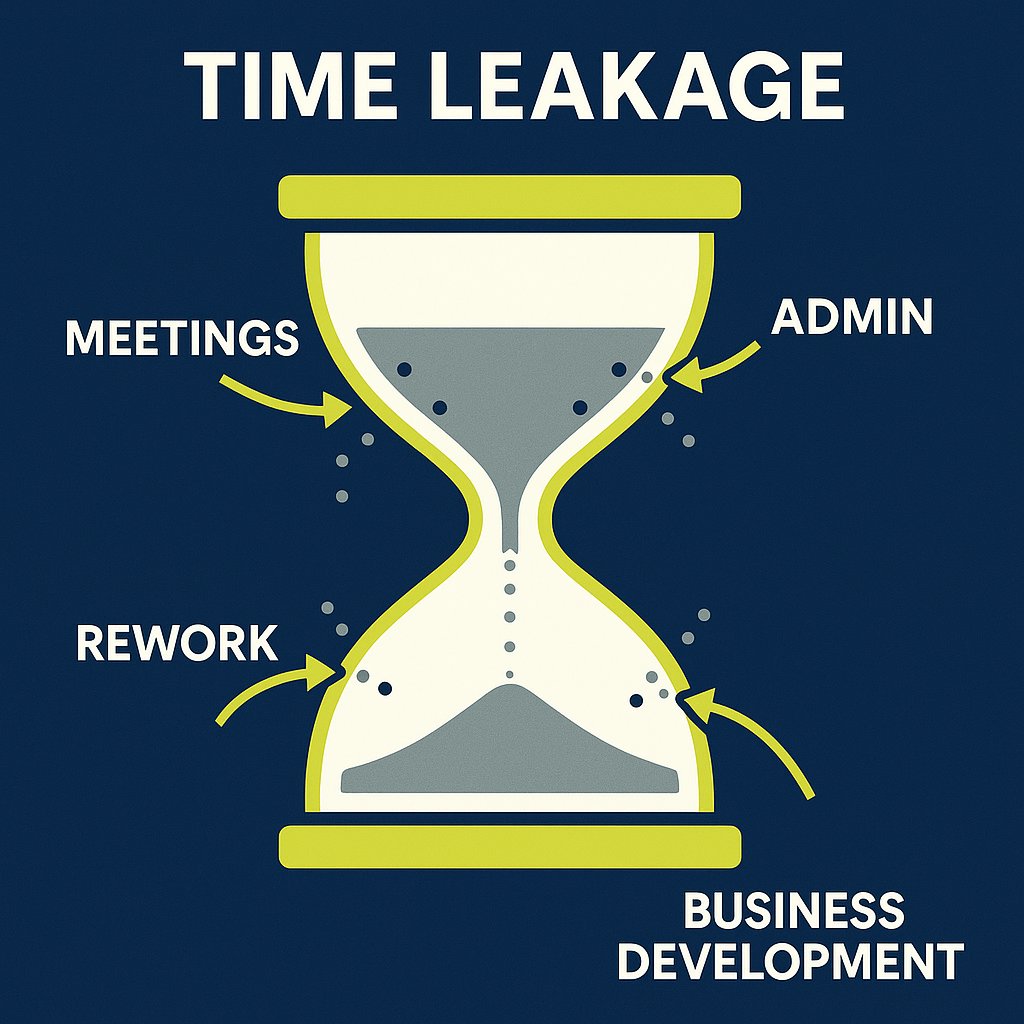
This phenomenon is called time leakage, and it’s driven by the single most underestimated threat to an agency’s financial health: untracked administrative time. It’s the steady accumulation of small, “invisible” tasks that never appear on an invoice but absolutely influence your results. At AURA, we’ve seen this pattern play out in dozens of creative, marketing, and tech agencies. It’s one of the most common—and most solvable—challenges they face. The good news is that you can plug the leaks. But first, you have to make the invisible visible.
The Anatomy of Invisible Work: What Untracked Admin Time Really Is
Before you can fix the problem, you need to be able to see it clearly in your own operations. “Admin time” isn’t just about filing paperwork; it’s a broad category of non-billable work that is essential for running the business but doesn’t directly generate revenue. When left untracked, it becomes a black hole for your margins. For marketing agencies, solid accounting and financial literacy basics are foundational for making this work visible.
Defining the Undefined
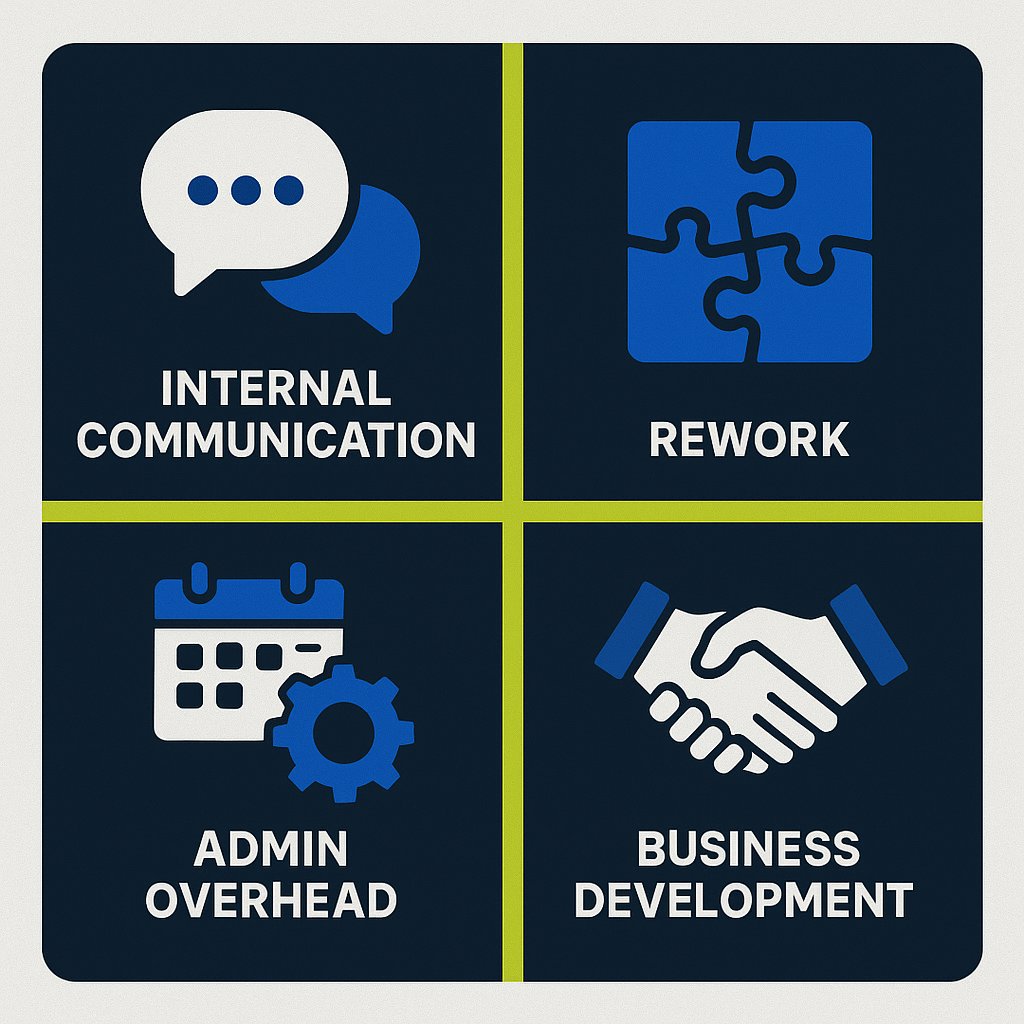
Most of this invisible work falls into four main categories:
- Internal Communication & Coordination: This is the time your team spends in internal status meetings, clarifying tasks over Slack, writing internal emails, and generally coordinating with each other. While necessary, these activities don’t directly advance a client deliverable and are rarely billable.
- Unplanned Rework & Revisions: There’s a critical difference between client-requested revisions (which should be scoped and potentially billable) and internal rework. Rework caused by a vague brief, a miscommunication, or an internal error is a pure, unrecoverable cost that directly eats into your profit margin.
- Operational & Administrative Overhead: These are the classic “cost of doing business” tasks. Think scheduling meetings, managing software and tools, invoicing, bookkeeping, and basic IT troubleshooting. While you can’t bill a client for the time your project manager spends organizing files, you still have to pay your PM for that hour. Not sure if your current approach is efficient? See the pros and cons of in-house versus outsourced accounting for agencies.
- Business Development: Time spent preparing proposals for prospective clients, writing quotes, and attending networking events is a vital investment in growth. However, because it isn’t tied to a specific, paying project, it often goes unmeasured, making it difficult to calculate your true client acquisition cost.
From Annoyance to Financial Drain: Quantifying the Leak
These small tasks seem harmless in isolation, but their cumulative effect is staggering. Consider this conservative calculation: in a 20-person agency, if each employee loses just 20 minutes per day to unrecorded tasks—a quick Slack clarification here, a few minutes of rework there—the numbers add up fast.
- 20 minutes/day × 20 people = 400 minutes/day
- 400 minutes/day = ~6.67 hours/day
- Over a standard 220-day work year, that’s 1,467 unbilled hours.
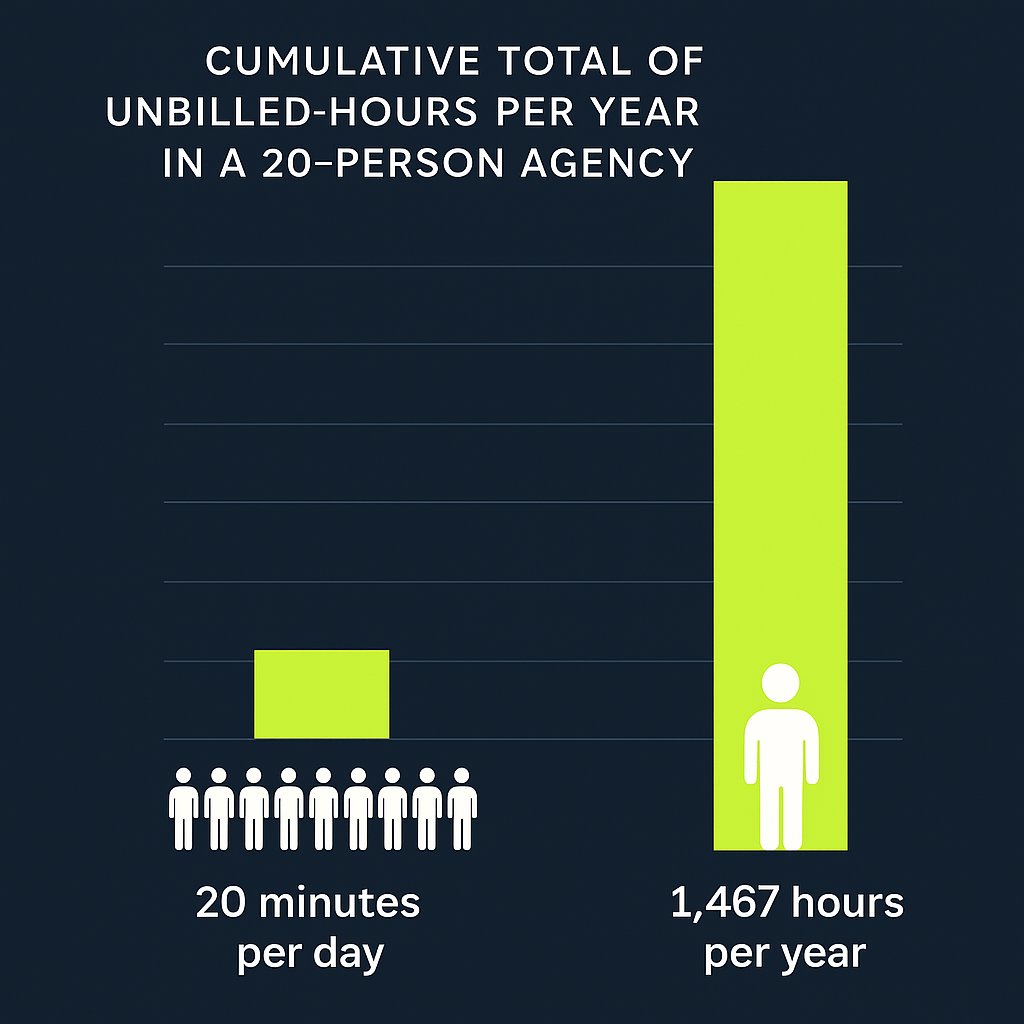
That’s the equivalent of having a full-time employee on your payroll whose entire year’s work generates zero revenue. This isn’t just a theoretical loss; it has three direct, damaging consequences for your agency:
- Distorted Project Pricing: If you build quotes and proposals based on an idealized workflow, but your projects consistently demand extra, untracked admin time, you are systematically underpricing your services. The project is unprofitable before it even begins because you’ve failed to account for the true effort required. Take a look at how financial statements can reveal underlying project issues and give you a clearer perspective for pricing.
- Inaccurate Capacity Planning: When a significant portion of your team’s time is invisible, you can’t accurately assess who is overworked and who is underutilized. You might think a designer is at 70% capacity and can take on a new project, but if 20% of their week is consumed by untracked rework and internal meetings, they’re actually at 90% and heading for burnout. This leads to reactive hiring decisions and puts team morale at risk.
- Hidden Inefficiencies: Untracked time is the perfect camouflage for broken processes. Without data, it’s impossible to spot bottlenecks. You can’t prove that your briefing process is flawed, that a certain client requires excessive hand-holding, or that a specific type of project always generates more rework. Instead of fixing the root cause, you continue to absorb the cost, accepting inefficiency as “the way things are”.
The real challenge is that this time leakage becomes normalized within the agency’s culture. Creatives often resist time tracking, fearing it will be used as a punitive tool for micromanagement, while leaders, focused on the next big win, can overlook the operational details that quietly erode the bottom line. This creates a vicious cycle: the work isn’t tracked because it’s considered unavoidable overhead, and because it isn’t tracked, its true cost is never understood, reinforcing the belief that it’s just a part of agency life. Breaking this cycle requires a shift in mindset—viewing operational data not as a threat, but as the key to building a more sustainable and profitable business. Learn more about how strategic time tracking transforms agency operations and breaks out of this loop.
Making the Invisible Visible: Your Three-Part Diagnostic Toolkit
Gaining control over your agency’s profitability starts with measurement. You can’t manage what you don’t measure. The good news is that the tools to do this are likely already at your fingertips. What most agencies lack is not the technology, but the integrated system for using it. True financial clarity comes from combining three components into a single, cohesive profitability engine: disciplined time tracking, project-based accounting in QuickBooks Online, and an accurate calculation of your direct labor costs. Getting your data right is essential—see why accurate accounting data underpins everything that follows.
Part 1: The Foundation – Disciplined Time Tracking as a Strategic Tool
The first step is to reframe the purpose of time tracking. It is not a tool for policing your team; it is a strategic data-gathering system that provides the raw material for smarter decisions about pricing, staffing, and process improvement. To get the clean data you need, implementation is key. Explore why accurate time tracking is essential for service-based agencies and how to get buy-in.
- Automate, Don’t Annoy: The biggest barrier to accurate time tracking is human friction. Forcing creatives to constantly pause their workflow to fill out a manual timesheet is a recipe for inaccurate or incomplete data. Implement tools that integrate directly with your project management software (like Asana, Jira, or Trello) and offer automated timers. The less your team has to think about the act of tracking, the more reliable the data will be.
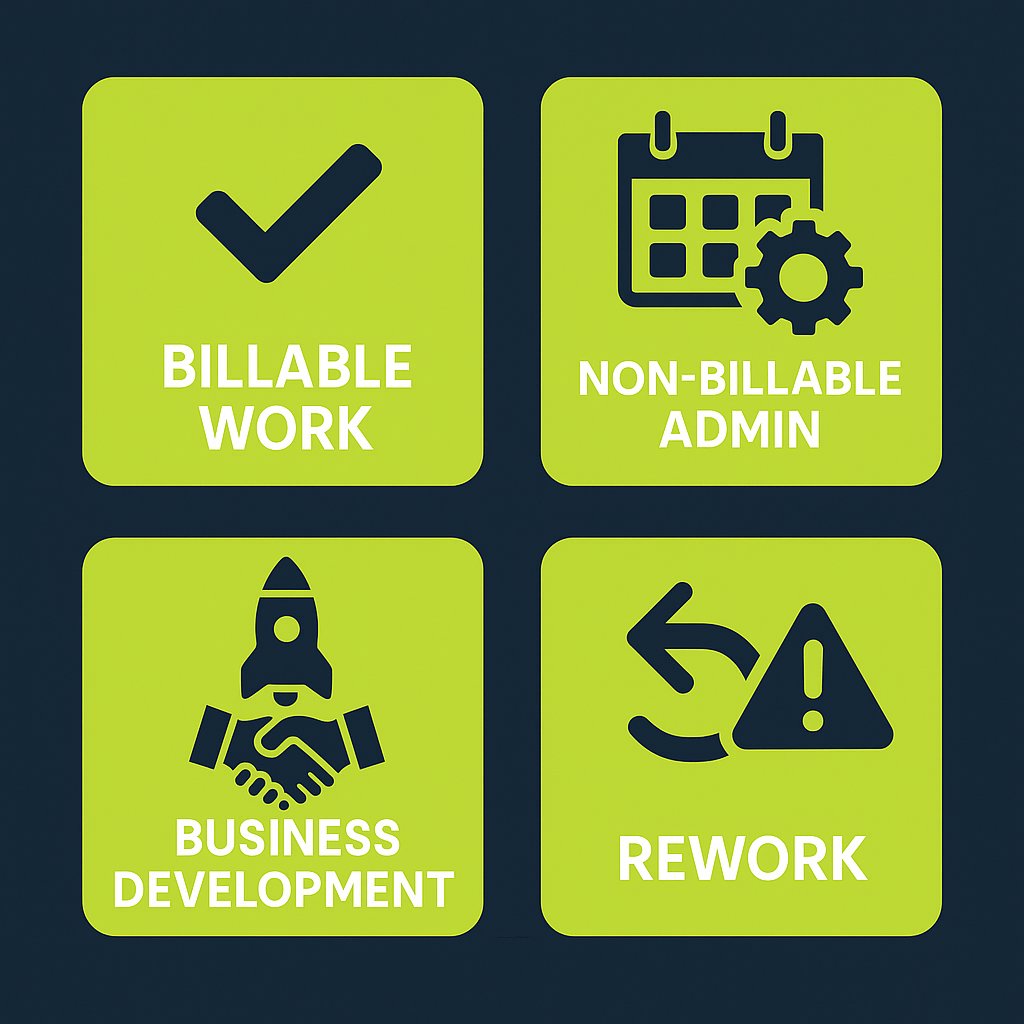
Define Your Categories Clearly: Vague data is useless data. Establish a simple, non-negotiable set of categories for all time entries. This ensures you can generate meaningful reports that separate the signal from the noise. A good starting point is:
- Billable: All work directly related to a client project deliverable.
- Non-Billable (Admin): Internal meetings, scheduling, tool management.
- Non-Billable (Business Development): Proposals, pitches, networking.
- Non-Billable (Rework): Time spent fixing internal errors or addressing issues from a poor brief. This category is crucial for identifying process failures.
- Track 100% of Time: Insist that your team tracks their full 40-hour work week, not just the billable parts. The most valuable insights for improving your operations are hidden in the non-billable data. It’s the only way to understand the true cost of inefficiency and the actual capacity of your team.
- Use Data to Empower, Not Punish: The data from time tracking should be the starting point for collaborative conversations, not punitive actions. Use it to protect your team. If a project is running over on hours, the data allows you to have a fact-based conversation with the client about scope creep. If rework hours are high, it provides evidence that your internal briefing process needs to be fixed. When positioned this way, time tracking becomes a tool that supports the team, rather than a system that scrutinizes them.
Part 2: The Central Hub – Setting Up QuickBooks Online for Project Profitability
Once you have a steady stream of accurate time data, you need a central hub to connect it with your financials. For most agencies, this hub is QuickBooks Online (QBO). By activating its often-overlooked ‘Projects’ feature, you can transform QBO from a simple bookkeeping tool into a powerful business intelligence platform.
Here’s how to set it up:
- Activation: First, turn on the feature. Go to the Gear icon > Account and Settings > Advanced . In the Projects section, toggle the feature on. This will add a new “Projects” tab to your main navigation menu.
- Creating a Project: In the Projects tab, you can create a new project for every client engagement, whether it’s a one-off job or a monthly retainer. Link each project to the corresponding customer in your QBO account.
- Connecting the Dots: This is the most critical step. You must rigorously assign all relevant financial activities to their specific project. This includes:
- Time Entries: When your team submits their timesheets (ideally through an integrated app), ensure every entry is assigned to a customer and the specific project.
- Expenses: When you enter a bill from a contractor, a purchase for stock photography, or any other direct cost, assign it to the correct project.
- Invoices: Create all your client invoices directly from within the project. This automatically links your revenue to the associated time and expenses.
- The One-Click Profitability Report: With everything linked, you can now navigate to any project in the Projects dashboard and click on the “Project Profitability” report. QBO will instantly generate a real-time Profit & Loss statement for that specific job. It automatically calculates your total income for the project and subtracts the total costs (both time and expenses), giving you a precise profit and margin figure for that engagement. This is the moment the invisible becomes visible.
Part 3: The Truth Metric – Calculating Your Fully Burdened Direct Labor Cost
There’s one final piece needed to make your QBO Project Profitability reports truly accurate: using the real cost of your team’s time. An employee’s salary is only one part of their total cost to your business. To understand true profitability, you must use a fully burdened direct labor rate , which accounts for all the costs associated with employing that person. If you’re unsure whether to use a cash or accrual approach, check out our guide to choosing the right accounting method for your business.
The fundamental flaw in most agencies’ financial analysis is using a simple hourly wage for job costing. This dramatically understates expenses and creates a dangerously inflated sense of profitability. The fully burdened rate includes:
- Gross Wages or Salary
- Employer-paid Payroll Taxes (e.g., Social Security, Medicare, state unemployment)
- Health Insurance Premiums
- Retirement Plan Contributions (e.g., 401k match)
- Workers’ Compensation Insurance
- Other Fringe Benefits (e.g., life insurance, professional development stipends, etc.).
The calculation is straightforward. You sum up all these annual costs for an employee and divide by their total annual work hours (typically 2,080 for a full-time employee).
| Cost Component | Annual Cost | Calculation Notes |
|---|---|---|
| Base Salary | $75,000 | |
| Payroll Taxes (Employer Share) | $6,500 | (Example: FICA, SUI, FUI) |
| Health Insurance Premium (Employer Share) | $8,000 | (Example: $667/month) |
| 401(k) Match (Employer Contribution) | $3,000 | (Example: 4% of salary) |
| Workers’ Compensation & Other Benefits | $1,500 | (Example: Insurance, stipends) |
| Total Annual Employee Cost | $94,000 | |
| Total Annual Work Hours | 2,080 | (40 hours/week x 52 weeks) |
| Fully Burdened Hourly Rate | $45.19 | (Total Annual Cost / Total Annual Hours) |
In this example, the employee with a $75,000 salary (which translates to a simple wage of $36.06/hour) actually costs the agency $45.19 for every hour they work. This is the “truth metric.” This is the number you must enter into the “Cost Rate” field for each employee in QBO. When you do this, every hour tracked against a project will reflect its true, fully burdened cost, making your Project Profitability reports incredibly powerful and accurate.
These three components—time tracking, QBO Projects, and burdened labor rates—are not a menu of options; they are an integrated, non-negotiable system. Time tracking provides the volume of labor. Direct labor allocation provides the true cost of that labor. QBO Projects is the engine that multiplies volume by cost and subtracts it from project revenue to reveal true profit. Without all three working in concert, you are flying blind. This integrated system is the foundation of a financially mature and scalable agency.
From Data to Decisions: How to Read the Financial Story Your Numbers Are Telling
With this new, accurate data flowing through your system, you can finally move from guessing to knowing. The numbers in your reports tell a story about your agency’s efficiency and profitability. Your job is to learn how to read it. There are two key metrics you need to master: your Billable Utilization Rate and your Profit Margins.
Are You Efficient? Understanding Your Billable Utilization Rate
Your Billable Utilization Rate is the single best metric for understanding your team’s operational efficiency. It measures what percentage of your team’s available time is spent on revenue-generating client work. For the fundamentals, you can also refer to our guide to key financial roles in agency operations.
The formula is simple: Utilization Rate = (Total Billable Hours/Total Available Hours) x 100
“Available Hours” is typically 40 hours per week per employee. It’s crucial to understand that 100% utilization is not the goal; it’s a direct path to burnout. A healthy agency needs non-billable time for internal meetings, training, and business development. Therefore, target utilization rates must be set by role, reflecting the different responsibilities of each position.
| Role | Target Utilization Rate | Rationale |
|---|---|---|
| Designers, Developers, Writers (Doers) | 75% – 85% | The majority of their time should be dedicated to direct client work and deliverables. |
| Project / Account Managers | 60% – 75% | Their role requires a balance of billable client work with non-billable internal coordination, planning, and client communication. |
| Strategists / Senior Leadership | 30% – 50% | A significant portion of their time must be reserved for non-billable strategic work, including team management, process improvement, and business development. |
| Agency Owners / Executives | 10% – 30% | Their primary focus is on running and growing the business, not on direct service delivery. |
By tracking utilization against these benchmarks, you can quickly spot problems. A design team consistently below 75% might indicate a weak sales pipeline or poor project scheduling. An account manager pushing 90% is a red flag for being overworked and at risk of burnout.
Are You Profitable? Decoding Your Gross and Net Profit Margins
While utilization measures efficiency, profit margins measure financial health. For an agency, there are two margins that matter most:
- Gross Margin: This metric shows the profitability of your service delivery before accounting for your general overhead (like rent, administrative salaries, and marketing). It answers the question: “Are we pricing our services correctly and delivering them efficiently?” A healthy benchmark for an agency is a Gross Margin of 50-60% or higher . Your QBO Project Profitability report is the perfect tool to measure this on a per-project basis.
- Net Profit Margin (or Operating Margin): This is your true bottom line. It measures the profitability of the entire agency after all costs—both direct delivery costs and overhead—have been paid. It answers the question: “Is the business as a whole financially sustainable?” For a healthy agency in the $1M–$5M revenue range, a Net Profit Margin of 15-25% is a strong target. This number is found at the bottom of your main P&L statement in QBO.
If your Delivery Margin is healthy but your Net Profit Margin is low, it’s a clear sign that your overhead is too high for your current revenue level. If both margins are low, it points to a more fundamental problem with pricing or delivery efficiency.
The Path to Control: Introducing AURA’s No-BS Profit Audit
We’ve covered a lot of ground. The core takeaway is this: untracked administrative time is a real, quantifiable threat to your agency’s financial stability. But it is not an unsolvable problem. By implementing an integrated system of disciplined time tracking, leveraging the power of QBO Projects, and applying the truth metric of fully burdened labor costs, you can gain complete visibility and control over your profitability.
We understand that implementing this system while also running your agency can feel overwhelming. That’s why we created AURA’s No-BS Profit Audit.
This isn’t just a report; it’s a hands-on, collaborative partnership designed to give the insights into your agency’s overall financial health and scalability:
- Review the Data: We get temporary access into your financial and time tracking data. Pulling the necessary reports and information needed to analyze your agency’s performance.
- Analyze the Data: We guide you through running the initial reports, benchmarking your agency’s current utilization and profitability against industry standards, and identifying the biggest and most immediate opportunities for improvement.
- Develop an Action Plan: Together, we pinpoint the primary sources of time leakage and process inefficiency in your agency. We then do a 90 day EBITDA lift roadmap to plug those leaks, optimize your workflows, and improve your margins.
The goal isn’t just to find problems; it’s to build a more resilient, scalable, and predictably profitable agency. Gaining control over your time is the first and most critical step on that journey. AURA is here to be your strategic partner, helping you take that step with clarity, confidence, and control.

Supporting Resources
- ( https://www.workamajig.com/blog/scalable-growth )
- ( https://c2fo.com/resources/cash-flow-management/cash-flow-management-5-strategies-for-service-companies/ )
- ( https://www.indinero.com/blog/when-to-hire-a-fractional-cfo/ )
Citations
- Magnetic.app. “Agency Profitability Playbook 2025.”
https://www.magnetic.app/blog/agency-profitability-playbook-2025 - Planarty. “What Are Billable Hours and How Do They Impact Profitability?”
https://www.planarty.com/blog/what-are-billable-hours/ - Function Point. “Agency Utilization Rate: How to Calculate and Improve It.”
https://functionpoint.com/blog/agency-utilization-rate-how-to-calculate-and-improve-it - Firm of the Future. “Help project-based clients work smarter with these two QuickBooks Online enhancements.”
https://www.firmofthefuture.com/accounting/help-project-based-clients-work-smarter-with-these-two-quickbooks-online-enhancements/ - GrowthForce. “Two Ways to Do Labor Cost Allocation.”
https://www.growthforce.com/blog/two-ways-to-do-labor-cost-allocation
Transform Your Agency with Strategic Time Tracking in 2025
Why Does My Agency Need Time Tracking? A CFO’s Guide to Unlocking Profitability and Clarity
It’s a familiar story for agency owners. The team is swamped, new clients are signing on, and revenue is climbing. You’re busier than you’ve ever been. So why does cash flow still feel tight? Why doesn’t the bottom line reflect all the incredible work your team is shipping? If you’ve ever looked at your P&L statement and thought, “This doesn’t feel right,” you’re not alone. This is the agency owner’s dilemma: being busy, but not knowing if you’re truly profitable.
For many creative, marketing, and tech agencies, the mere mention of “time tracking” can trigger a collective groan. It’s often seen as a straightjacket on the fluid, non-linear creative process—an administrative burden that stifles innovation. To your team, it can feel like a tool for micromanagement, a way for “big brother” to watch their every move. And if you’re not billing by the hour, it can seem like a completely pointless exercise.
Let’s reframe the conversation.
Effective time tracking is not about surveillance. It’s about intelligence. It is the single most critical source of business data your agency can have, transforming your leadership from reactive and gut-driven to proactive and strategic. It is the foundational layer for gaining the clarity, confidence, and control you need to scale profitably.
Often, the most painful issues in an agency—like team burnout, high employee turnover, and tense client relationships—are treated as HR or account management problems. But in reality, they are lagging indicators of a deeper financial and operational issue. The chain of events is clear: without historical data on how long projects actually take, scoping is guesswork. This guesswork leads to underpricing and a constant battle with scope creep, where extra revisions and requests slowly erode your margins. The result? An overworked, burnt-out team and a profitability problem that no amount of team-building can fix. Time tracking provides the objective data needed to solve the root cause, not just treat the symptoms.
Part I: The Strategic Shift—From Tracking Hours to Tracking Value
To truly understand the power of time tracking, you have to stop seeing it as an administrative task and start seeing it as a C-suite level strategic tool. It’s not about counting minutes; it’s about understanding the fundamental economics of your business.
Uncovering Your True Profitability: The Difference Between Revenue and Sanity
Top-line revenue is a vanity metric. It feels good to say you’re a “$3 million agency,” but if your expenses are $2.95 million, that number doesn’t mean much. Profit is what funds your growth, your team’s salaries, and your own sanity. Many agencies chase revenue growth while their profitability flatlines because they don’t have visibility into their biggest cost: their team’s time.
Time data is the only way to calculate the true profitability of every client, every project, and every service you offer. It allows you to calculate your “delivery margin”—the profit you generate from client work after the full cost of your team’s labor is accounted for. For example, a flashy $100,000 project that consumes 1,000 team hours might have a lower delivery margin than a less glamorous $80,000 project that only takes 500 hours. Without time data, you might be fighting to win more of the wrong kind of work.
Mastering Your Pricing and Scoping: From Guesswork to Confidence
Underpricing is one of the most common and destructive financial mistakes an agency can make. It often happens because, without data, you’re guessing what a project will cost to deliver. Time tracking is the antidote. Having a historical record of the actual hours your team spent on similar projects is the only way to build accurate, data-driven proposals that protect your margins from day one.
This data-backed confidence is also what empowers you to move away from hourly billing and toward more profitable value-based pricing models. When you know your true costs with certainty, you can price your services based on the immense value you deliver to the client, not the hours it takes to produce the work.
Furthermore, it gives you a powerful tool to combat scope creep. When a client asks for “just one more small revision,” you can move the conversation from subjective to objective. Instead of a difficult negotiation, it becomes a simple, data-informed statement: “We’d be happy to. The original scope included 15 hours for revisions, which we’ve used. Our data shows this next round will take approximately 5 additional hours. We can add that to the project for [cost].” This protects your team, your timeline, and your profitability.
Optimizing Your Most Valuable Asset: Your Team
For any agency, your single largest investment and expense is your people. Time tracking is the primary tool for managing that investment effectively. The data it generates provides a clear picture of resource allocation across the entire agency. It instantly reveals who is consistently over-utilized and at risk of burnout, and who is under-utilized, signaling a potential inefficiency or a need to fill the sales pipeline. This allows you to balance workloads intelligently, keeping your team healthy and productive.
This data also transforms performance reviews. Instead of relying solely on subjective feedback, you have objective metrics. You can see an employee’s efficiency, identify their most profitable skills, and find opportunities for professional development. For instance, you might discover a designer who is slower on logo projects but exceptionally fast and profitable when creating website mockups. This insight allows you to channel them toward their highest-value work, benefiting both the employee and the agency’s bottom line.
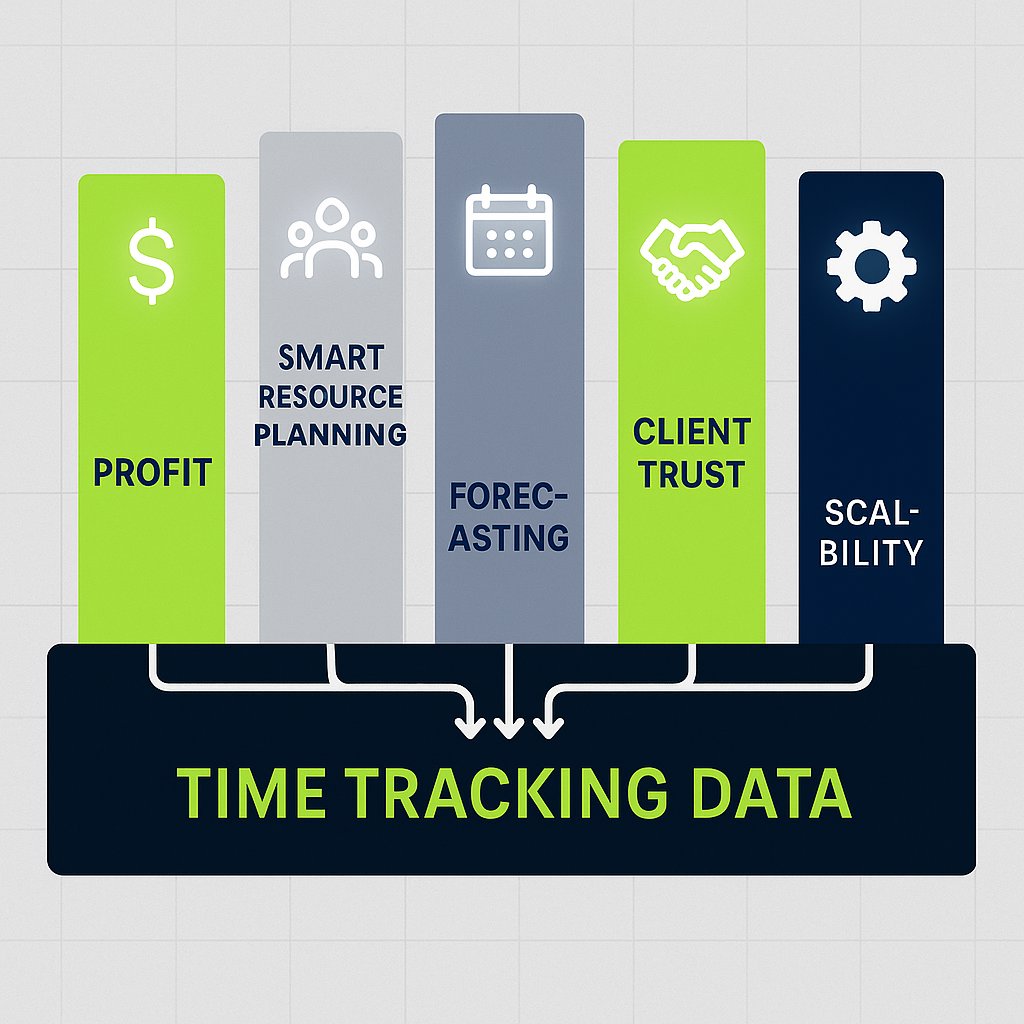
Part II: The Five Pillars of a Financially Healthy Agency
Implementing time tracking isn’t just about collecting data; it’s about building a stronger, more resilient, and more profitable business. The data you gather becomes the foundation for five essential pillars of agency health.
Pillar 1: Crystal-Clear Project & Client Profitability
A standard P&L statement gives you a blended, high-level view of your business. It can tell you if you were profitable last month, but it can’t tell you why. Was it because of Client A, or in spite of Client B? To make strategic decisions, you need granular data. By tracking time and understanding the “fully loaded cost” per employee (which includes salary, benefits, and a share of overhead), you can analyze every project with surgical precision.
This simple analysis can be revolutionary. It moves the invisible cost of your team’s time onto the balance sheet for each project, revealing which clients are fueling your growth and which are silently draining your resources. If you’re not sure your data is strong, accurate data in accounting is essential to give you confidence in your results.
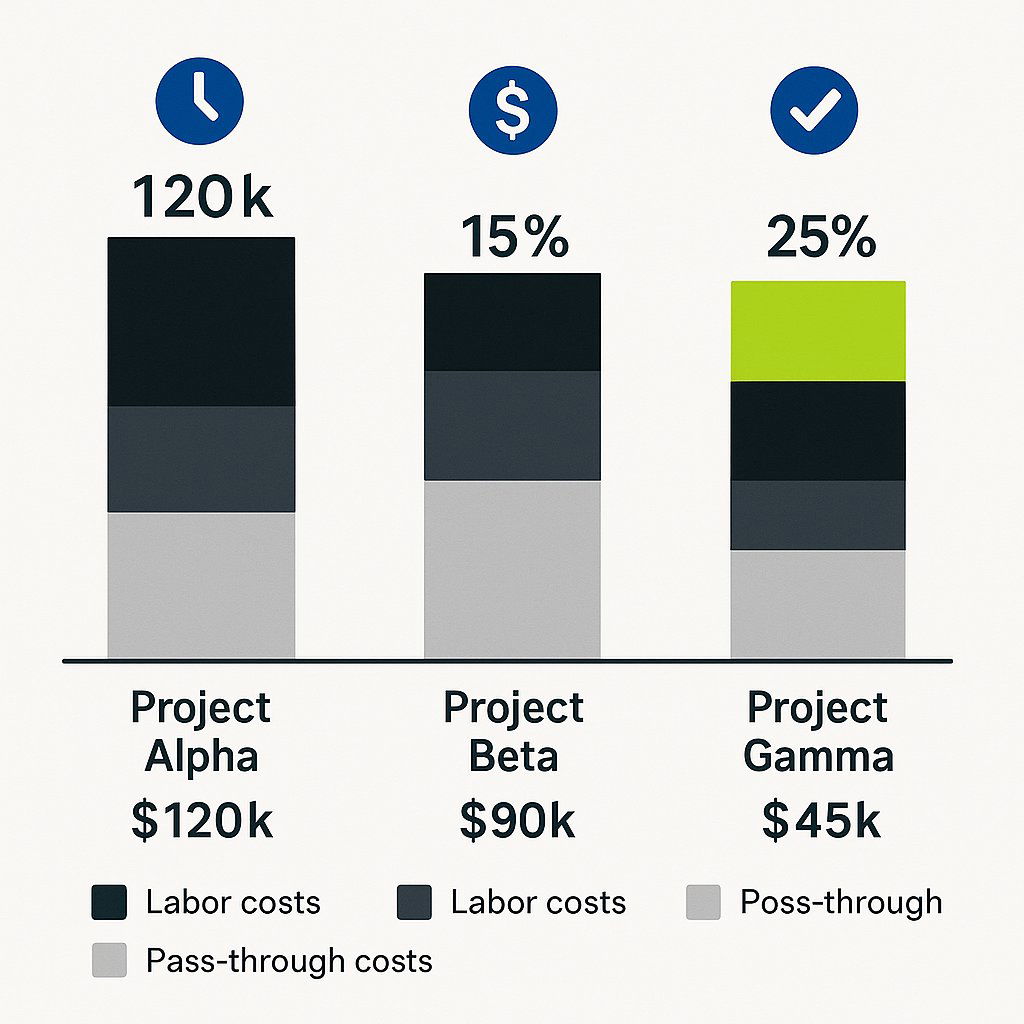
| Metric | Example Project A | Calculation Notes |
|---|---|---|
| Project Revenue | $50,000 | The total fee charged to the client. |
| Pass-Through Costs | ($5,000) | Ad spend, stock photos, contractor fees, etc. |
| Adjusted Gross Income (AGI) | $45,000 | Revenue - Pass-Through Costs |
| Total Hours Tracked | 410 hours | Sum of all team hours from your time tracking tool. |
| Avg. Fully Loaded Cost/Hour | $75/hr | Your agency’s average employee cost. |
| Total Labor Cost | ($30,750) | Total Hours Tracked * Avg. Cost/Hour |
| Net Profit | $14,250 | AGI - Total Labor Cost |
| Profit Margin | 31.7% | (Net Profit / AGI) * 100 |
Pillar 2: Data-Driven Resource & Capacity Planning
Without data, key decisions like hiring are often based on “feeling busy.” Time tracking replaces that feeling with facts. When you can see that your team is consistently operating at or above capacity on billable work, you know that a new hire is not just a cost, but an investment that the business can support and requires to grow.
This data is also crucial for capacity planning. By analyzing past projects, you can understand your team’s true capacity for work, which prevents you from over-promising and under-delivering to clients. It also informs the critical hire vs. outsource decision. If your data shows a consistent need for 15 hours per week of specialized copywriting, for example, it may be far more profitable to bring on a part-time employee than to continue paying a premium for freelancers.
Pillar 3: Accurate Forecasting & Predictable Cash Flow
The “feast or famine” cycle is a classic agency struggle, and it stems from a lack of predictability. When you know precisely how long your projects take and what your true profit margins are, you can forecast future revenue and expenses with a much higher degree of accuracy.
This predictability is a game-changer. It allows you to make strategic investments in new services, technology, or marketing with the confidence that you will have the cash flow to support them. It also provides the perfect tool for managing retainers. With time tracking, you can easily see if a client is consistently using more hours than their agreement covers, giving you clear, undeniable evidence to justify a conversation about increasing the retainer or scoping a new project—and to steer the business toward predictable cash flow over time.
Pillar 4: Radical Client Transparency & Trust
Many agencies view sharing time reports with clients as a defensive move, something you only do when an invoice is questioned. This is a missed opportunity. Proactively sharing simplified reports is a powerful way to build trust and strengthen relationships.
These reports demonstrate the immense value your team is delivering behind the scenes. They justify budgets and build client confidence, turning your relationship from a simple vendor transaction into a strategic partnership. The conversation shifts from “How much does this cost?” to “How can we best allocate our budget for maximum impact?” with you positioned as the trusted, data-informed advisor.
Pillar 5: A Scalable Operational Engine
Finally, time tracking is the key to building an agency that can grow without breaking. The data it generates is a spotlight that illuminates hidden inefficiencies and bottlenecks in your delivery process. Are you spending too much time on non-billable internal meetings? Does the QA phase of every web project take 50% longer than you estimated?
Answering these questions is the foundation of continuous improvement. By identifying and fixing these operational drags, you make your service delivery more efficient. For every fixed-fee project, that increased efficiency translates directly into higher profit margins. These refined, standardized, and data-proven processes create a scalable engine that allows your agency to take on more work without sacrificing quality or profitability.
Part III: The Implementation Playbook—Making Time Tracking Stick
Knowing why you need to track time is one thing; getting your team to do it consistently is another. Success depends less on the software you choose and more on the culture you build around it.
Step 1: Gaining Team Buy-In (It’s Not Big Brother)
The single biggest obstacle to successful time tracking is employee resistance, which is almost always rooted in the fear of being micromanaged. If your team believes the data will be used to punish them for taking “too long” on a task, they will either resist the process or fudge their numbers, making the data useless.
Therefore, the rollout must be framed as a tool for empowerment, not enforcement. The conversation should focus entirely on the benefits to the team. When introducing the initiative, use talking points that address their primary concerns:
- “This is our best tool to prevent burnout.” By making workloads visible, we can see who is overloaded and rebalance tasks before anyone gets overwhelmed.
- “This will help us set more realistic deadlines.” With accurate data, we can stop over-promising and create project timelines that are achievable without late nights and weekend work.
- “This data is how we justify hiring more people.” When we can prove we’re at capacity, it builds the business case for bringing in more help to support you.
- “This helps us recognize and reward your hard work.” Objective data on efficiency and profitability provides tangible evidence to support raises and promotions.
Crucially, leadership must lead by example. Track your own time and be transparent about what you’re learning. When the team sees that time data leads directly to a new hire that eases their workload, they will become your biggest advocates.
Step 2: Designing Your Framework & Choosing Your Tools
Don’t overcomplicate the setup. The goal is consistent adoption, not forensic-level detail. Start with a simple, logical framework that everyone can understand. A great starting point is:
- Level 1: Client
- Level 2: Project
- Level 3: Task/Service Line (e.g., Strategy, Design, Development, Project Management)
- Tag: Billable vs. Non-Billable
When choosing software, user-friendliness is the most important feature. The tool should be simple, intuitive, and feel seamless. Look for solutions that integrate directly with the project management tools your team already uses, like Asana, ClickUp, or Trello. This reduces friction by allowing them to track time without constantly switching tabs. Popular and effective tools for agencies include Harvest, Toggl, and Everhour.
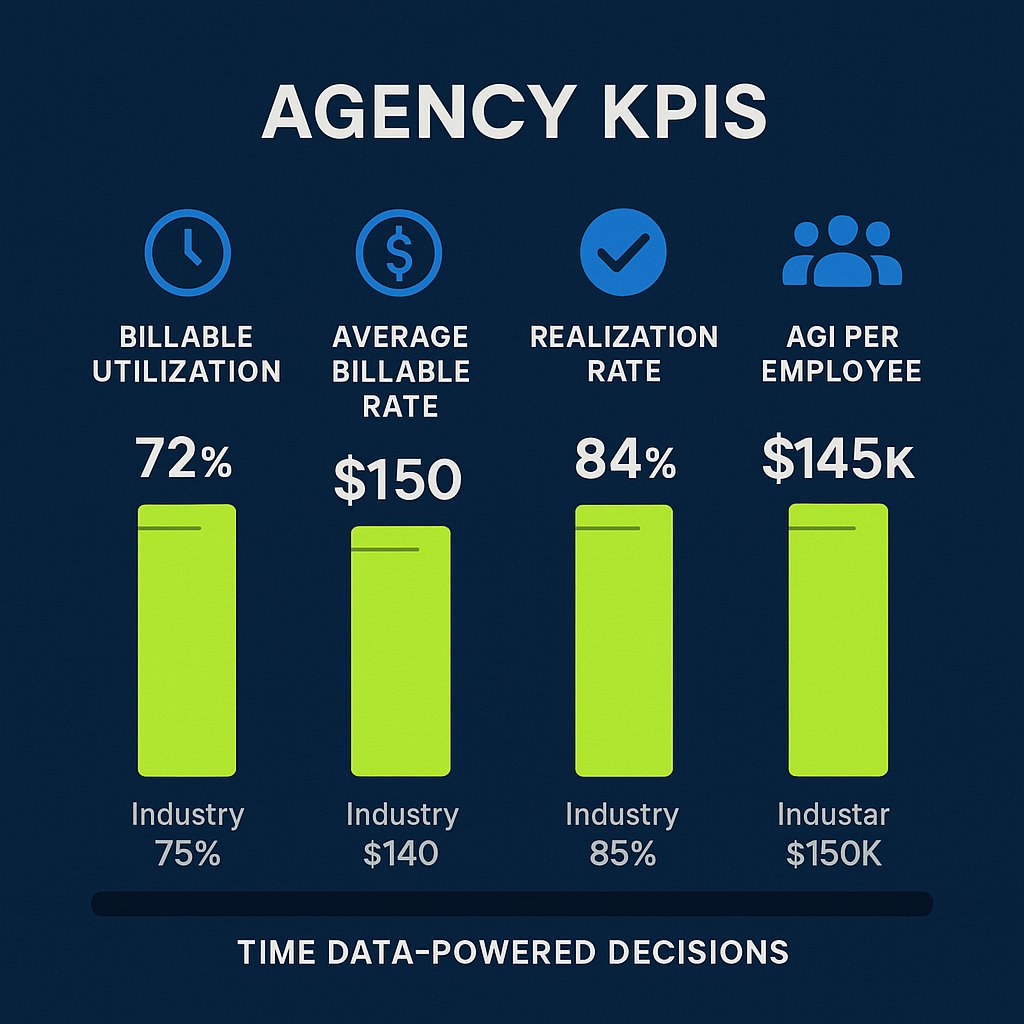
Step 3: From Data to Decisions—The KPIs That Matter
Collecting data is pointless if you don’t use it to make better decisions. By translating raw time data into a handful of Key Performance Indicators (KPIs), you can create a simple dashboard to monitor the health of your agency every month. And if you want to clarify the difference between finance roles, bookkeeper vs accountant vs controller vs CFO can help you understand how each position supports agency analytics and reporting.
| KPI | Formula | Industry Target | What It Reveals |
|---|---|---|---|
| Billable Utilization Rate | (Total Billable Hours / Total Capacity Hours) * 100 |
75-80% | Are we spending enough time on revenue-generating work? A low rate signals inefficiency or overstaffing. |
| Average Billable Rate (ABR) | Adjusted Gross Income / Total Hours Tracked |
Varies by agency | What is the effective hourly rate we earn? This helps identify your most profitable types of work. |
| Realization Rate | (Billed Hours / Billable Hours) * 100 |
>95% | Are we actually billing for all the billable work we do? A low rate indicates scope creep, write-offs, or over-servicing. |
| AGI per Employee | Total AGI / # of Full-Time Employees |
$150,000+ | Is our business model efficient? This is a key indicator of overall agency health and scalability. |
Conclusion: Your Agency’s New Compass
Time tracking is not just another task to add to your team’s plate. It is your agency’s compass. It provides the objective, reliable data you need to navigate the challenges of growth, pricing, and staffing. It gives you clarity on where your profits truly come from, the confidence to make bold strategic decisions, and ultimate control over your agency’s financial future.
Ready to take the first step? Don’t worry about buying and implementing a new tool just yet. This week, ask your team to track their time for a single project on a simple shared spreadsheet. At the end of the project, use the Project Profitability Analysis template from this article to see what the data tells you. The insights will likely surprise you—and set you on the path to more predictable, profitable growth.
Gaining financial clarity is a journey. When you’re ready to turn these insights into a strategic financial plan for your agency, our team at AURA is here to help you read the map.
Citations
- Goodey, Ben. “The Financial Fog: 8 Signs Your Agency’s Underperforming.” Scoro, https://www.scoro.com/blog/agency-financial-mistakes/.
- Petitpas, Marcel. “Agency Time Tracking – The Right Way.” Parakeeto, 23 June 2025, https://parakeeto.com/blog/how-to-track-time-with-marcel-petipas-episode-42/.
- McLellan, Drew. “How to Manage Small Business Finances as an Agency Owner with Jason Blumer.” Agency Management Institute, https://agencymanagementinstitute.com/how-to-manage-small-business-finances/.