
Stop the Silent Profit Leak: Unlock Agency Growth with Better Time Management
The Silent Margin Killer in Every Agency: Untracked Admin Time
That Gut Feeling Is Right: Your Agency Is Leaking Profit. Here’s Where to Find the Holes.
You’ve just closed the books on another strong quarter. Revenue is up, the client roster is growing, and your team is firing on all cylinders. But as you stare at the Profit & Loss statement, a familiar, nagging feeling creeps in. The top line looks great, but the bottom line—the actual cash left over—feels disappointingly thin. You find yourself asking the same questions every month: Where is all the money going? Why does it feel like we’re running faster just to stay in the same place?
That gut feeling is right. Your agency is likely leaking profit, but not in the way you might think. It’s not one big, obvious expense. It’s a slow, silent drain caused by thousands of tiny, unrecorded moments that add up to a significant financial hit. Profitability in a service business rarely disappears overnight; it erodes quietly through the daily grind of misaligned teams, uncontrolled scope, and the kind of rework that has become business-as-usual.
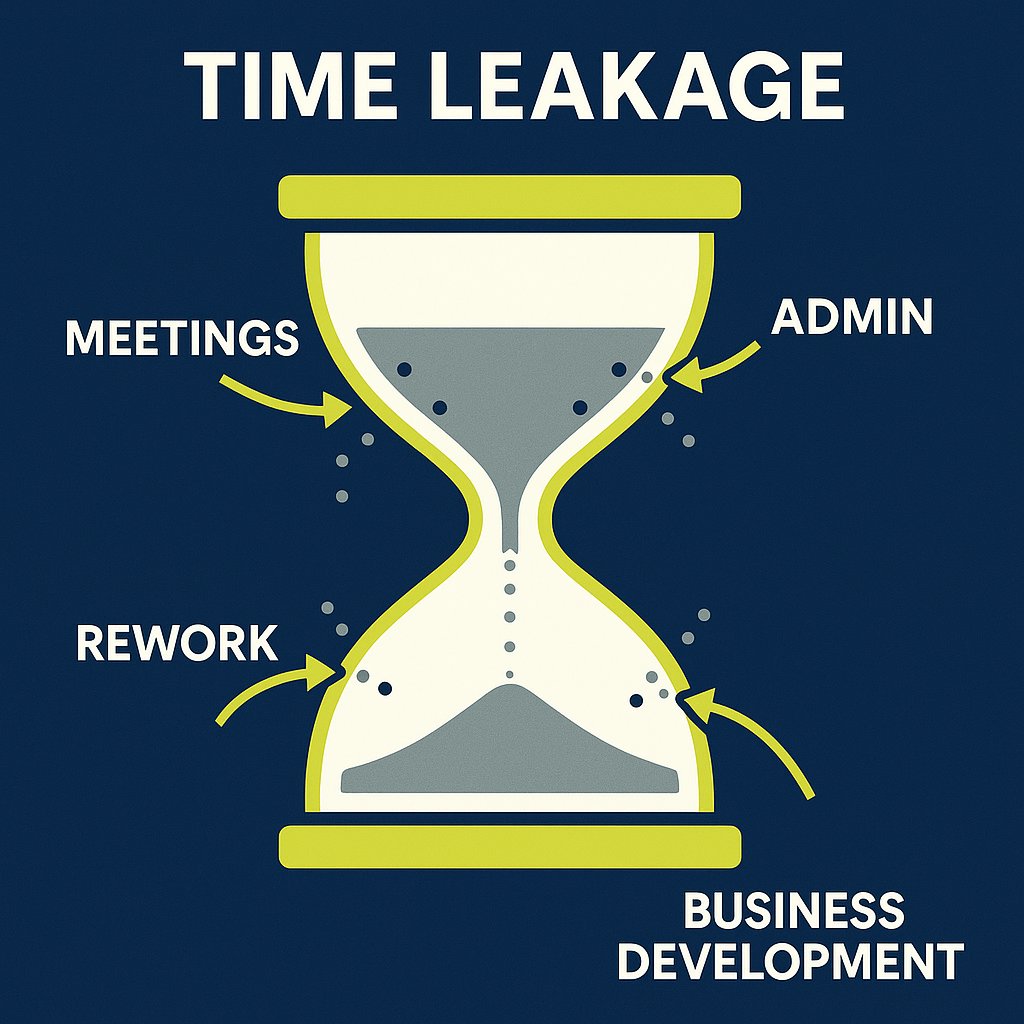
This phenomenon is called time leakage, and it’s driven by the single most underestimated threat to an agency’s financial health: untracked administrative time. It’s the steady accumulation of small, “invisible” tasks that never appear on an invoice but absolutely influence your results. At AURA, we’ve seen this pattern play out in dozens of creative, marketing, and tech agencies. It’s one of the most common—and most solvable—challenges they face. The good news is that you can plug the leaks. But first, you have to make the invisible visible.
The Anatomy of Invisible Work: What Untracked Admin Time Really Is
Before you can fix the problem, you need to be able to see it clearly in your own operations. “Admin time” isn’t just about filing paperwork; it’s a broad category of non-billable work that is essential for running the business but doesn’t directly generate revenue. When left untracked, it becomes a black hole for your margins. For marketing agencies, solid accounting and financial literacy basics are foundational for making this work visible.
Defining the Undefined
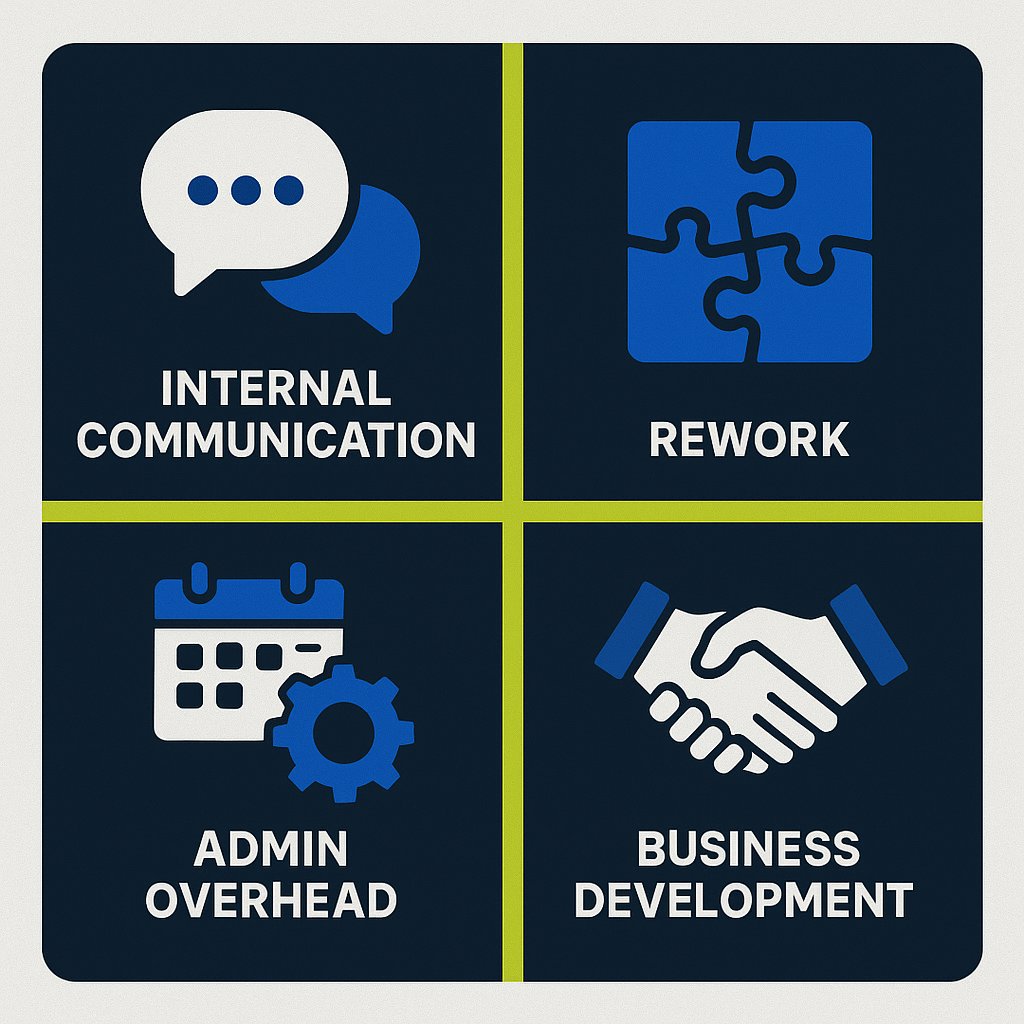
Most of this invisible work falls into four main categories:
- Internal Communication & Coordination: This is the time your team spends in internal status meetings, clarifying tasks over Slack, writing internal emails, and generally coordinating with each other. While necessary, these activities don’t directly advance a client deliverable and are rarely billable.
- Unplanned Rework & Revisions: There’s a critical difference between client-requested revisions (which should be scoped and potentially billable) and internal rework. Rework caused by a vague brief, a miscommunication, or an internal error is a pure, unrecoverable cost that directly eats into your profit margin.
- Operational & Administrative Overhead: These are the classic “cost of doing business” tasks. Think scheduling meetings, managing software and tools, invoicing, bookkeeping, and basic IT troubleshooting. While you can’t bill a client for the time your project manager spends organizing files, you still have to pay your PM for that hour. Not sure if your current approach is efficient? See the pros and cons of in-house versus outsourced accounting for agencies.
- Business Development: Time spent preparing proposals for prospective clients, writing quotes, and attending networking events is a vital investment in growth. However, because it isn’t tied to a specific, paying project, it often goes unmeasured, making it difficult to calculate your true client acquisition cost.
From Annoyance to Financial Drain: Quantifying the Leak
These small tasks seem harmless in isolation, but their cumulative effect is staggering. Consider this conservative calculation: in a 20-person agency, if each employee loses just 20 minutes per day to unrecorded tasks—a quick Slack clarification here, a few minutes of rework there—the numbers add up fast.
- 20 minutes/day × 20 people = 400 minutes/day
- 400 minutes/day = ~6.67 hours/day
- Over a standard 220-day work year, that’s 1,467 unbilled hours.
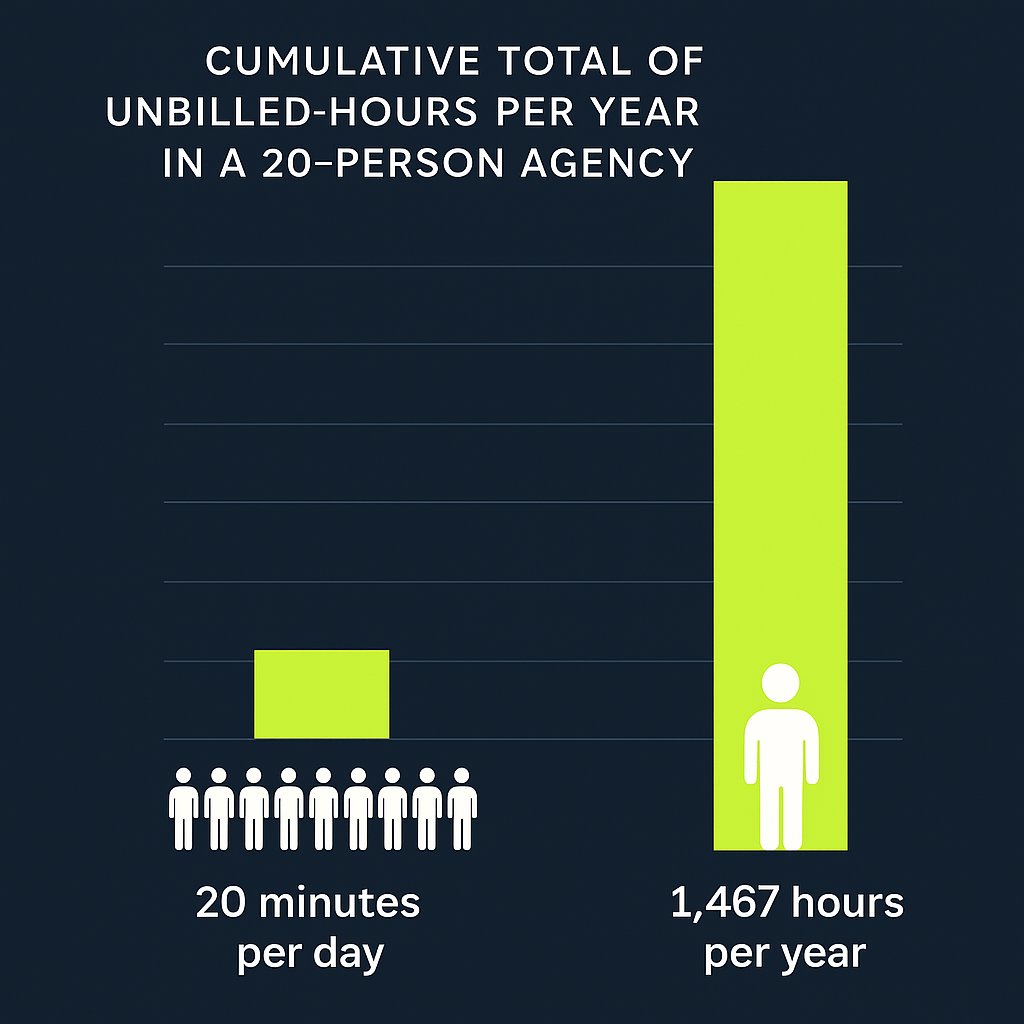
That’s the equivalent of having a full-time employee on your payroll whose entire year’s work generates zero revenue. This isn’t just a theoretical loss; it has three direct, damaging consequences for your agency:
- Distorted Project Pricing: If you build quotes and proposals based on an idealized workflow, but your projects consistently demand extra, untracked admin time, you are systematically underpricing your services. The project is unprofitable before it even begins because you’ve failed to account for the true effort required. Take a look at how financial statements can reveal underlying project issues and give you a clearer perspective for pricing.
- Inaccurate Capacity Planning: When a significant portion of your team’s time is invisible, you can’t accurately assess who is overworked and who is underutilized. You might think a designer is at 70% capacity and can take on a new project, but if 20% of their week is consumed by untracked rework and internal meetings, they’re actually at 90% and heading for burnout. This leads to reactive hiring decisions and puts team morale at risk.
- Hidden Inefficiencies: Untracked time is the perfect camouflage for broken processes. Without data, it’s impossible to spot bottlenecks. You can’t prove that your briefing process is flawed, that a certain client requires excessive hand-holding, or that a specific type of project always generates more rework. Instead of fixing the root cause, you continue to absorb the cost, accepting inefficiency as “the way things are”.
The real challenge is that this time leakage becomes normalized within the agency’s culture. Creatives often resist time tracking, fearing it will be used as a punitive tool for micromanagement, while leaders, focused on the next big win, can overlook the operational details that quietly erode the bottom line. This creates a vicious cycle: the work isn’t tracked because it’s considered unavoidable overhead, and because it isn’t tracked, its true cost is never understood, reinforcing the belief that it’s just a part of agency life. Breaking this cycle requires a shift in mindset—viewing operational data not as a threat, but as the key to building a more sustainable and profitable business. Learn more about how strategic time tracking transforms agency operations and breaks out of this loop.
Making the Invisible Visible: Your Three-Part Diagnostic Toolkit
Gaining control over your agency’s profitability starts with measurement. You can’t manage what you don’t measure. The good news is that the tools to do this are likely already at your fingertips. What most agencies lack is not the technology, but the integrated system for using it. True financial clarity comes from combining three components into a single, cohesive profitability engine: disciplined time tracking, project-based accounting in QuickBooks Online, and an accurate calculation of your direct labor costs. Getting your data right is essential—see why accurate accounting data underpins everything that follows.
Part 1: The Foundation – Disciplined Time Tracking as a Strategic Tool
The first step is to reframe the purpose of time tracking. It is not a tool for policing your team; it is a strategic data-gathering system that provides the raw material for smarter decisions about pricing, staffing, and process improvement. To get the clean data you need, implementation is key. Explore why accurate time tracking is essential for service-based agencies and how to get buy-in.
- Automate, Don’t Annoy: The biggest barrier to accurate time tracking is human friction. Forcing creatives to constantly pause their workflow to fill out a manual timesheet is a recipe for inaccurate or incomplete data. Implement tools that integrate directly with your project management software (like Asana, Jira, or Trello) and offer automated timers. The less your team has to think about the act of tracking, the more reliable the data will be.
Define Your Categories Clearly: Vague data is useless data. Establish a simple, non-negotiable set of categories for all time entries. This ensures you can generate meaningful reports that separate the signal from the noise. A good starting point is:
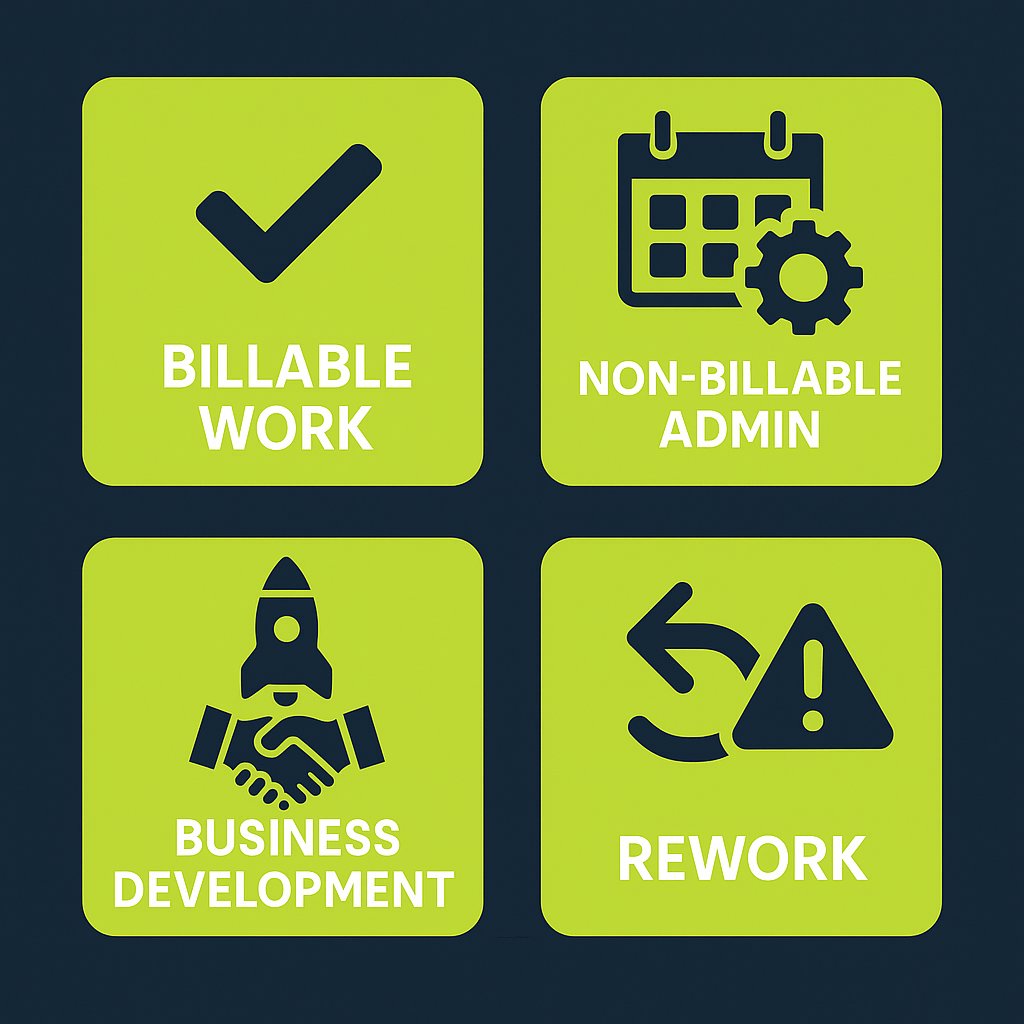
- Billable: All work directly related to a client project deliverable.
- Non-Billable (Admin): Internal meetings, scheduling, tool management.
- Non-Billable (Business Development): Proposals, pitches, networking.
- Non-Billable (Rework): Time spent fixing internal errors or addressing issues from a poor brief. This category is crucial for identifying process failures.
- Track 100% of Time: Insist that your team tracks their full 40-hour work week, not just the billable parts. The most valuable insights for improving your operations are hidden in the non-billable data. It’s the only way to understand the true cost of inefficiency and the actual capacity of your team.
- Use Data to Empower, Not Punish: The data from time tracking should be the starting point for collaborative conversations, not punitive actions. Use it to protect your team. If a project is running over on hours, the data allows you to have a fact-based conversation with the client about scope creep. If rework hours are high, it provides evidence that your internal briefing process needs to be fixed. When positioned this way, time tracking becomes a tool that supports the team, rather than a system that scrutinizes them.
Part 2: The Central Hub – Setting Up QuickBooks Online for Project Profitability
Once you have a steady stream of accurate time data, you need a central hub to connect it with your financials. For most agencies, this hub is QuickBooks Online (QBO). By activating its often-overlooked ‘Projects’ feature, you can transform QBO from a simple bookkeeping tool into a powerful business intelligence platform.
Here’s how to set it up:
- Activation: First, turn on the feature. Go to the Gear icon > Account and Settings > Advanced . In the Projects section, toggle the feature on. This will add a new “Projects” tab to your main navigation menu.
- Creating a Project: In the Projects tab, you can create a new project for every client engagement, whether it’s a one-off job or a monthly retainer. Link each project to the corresponding customer in your QBO account.
- Connecting the Dots: This is the most critical step. You must rigorously assign all relevant financial activities to their specific project. This includes:
- Time Entries: When your team submits their timesheets (ideally through an integrated app), ensure every entry is assigned to a customer and the specific project.
- Expenses: When you enter a bill from a contractor, a purchase for stock photography, or any other direct cost, assign it to the correct project.
- Invoices: Create all your client invoices directly from within the project. This automatically links your revenue to the associated time and expenses.
- The One-Click Profitability Report: With everything linked, you can now navigate to any project in the Projects dashboard and click on the “Project Profitability” report. QBO will instantly generate a real-time Profit & Loss statement for that specific job. It automatically calculates your total income for the project and subtracts the total costs (both time and expenses), giving you a precise profit and margin figure for that engagement. This is the moment the invisible becomes visible.
Part 3: The Truth Metric – Calculating Your Fully Burdened Direct Labor Cost
There’s one final piece needed to make your QBO Project Profitability reports truly accurate: using the real cost of your team’s time. An employee’s salary is only one part of their total cost to your business. To understand true profitability, you must use a fully burdened direct labor rate , which accounts for all the costs associated with employing that person. If you’re unsure whether to use a cash or accrual approach, check out our guide to choosing the right accounting method for your business.
The fundamental flaw in most agencies’ financial analysis is using a simple hourly wage for job costing. This dramatically understates expenses and creates a dangerously inflated sense of profitability. The fully burdened rate includes:
- Gross Wages or Salary
- Employer-paid Payroll Taxes (e.g., Social Security, Medicare, state unemployment)
- Health Insurance Premiums
- Retirement Plan Contributions (e.g., 401k match)
- Workers’ Compensation Insurance
- Other Fringe Benefits (e.g., life insurance, professional development stipends, etc.).
The calculation is straightforward. You sum up all these annual costs for an employee and divide by their total annual work hours (typically 2,080 for a full-time employee).
| Cost Component | Annual Cost | Calculation Notes |
|---|---|---|
| Base Salary | $75,000 | |
| Payroll Taxes (Employer Share) | $6,500 | (Example: FICA, SUI, FUI) |
| Health Insurance Premium (Employer Share) | $8,000 | (Example: $667/month) |
| 401(k) Match (Employer Contribution) | $3,000 | (Example: 4% of salary) |
| Workers’ Compensation & Other Benefits | $1,500 | (Example: Insurance, stipends) |
| Total Annual Employee Cost | $94,000 | |
| Total Annual Work Hours | 2,080 | (40 hours/week x 52 weeks) |
| Fully Burdened Hourly Rate | $45.19 | (Total Annual Cost / Total Annual Hours) |
In this example, the employee with a $75,000 salary (which translates to a simple wage of $36.06/hour) actually costs the agency $45.19 for every hour they work. This is the “truth metric.” This is the number you must enter into the “Cost Rate” field for each employee in QBO. When you do this, every hour tracked against a project will reflect its true, fully burdened cost, making your Project Profitability reports incredibly powerful and accurate.
These three components—time tracking, QBO Projects, and burdened labor rates—are not a menu of options; they are an integrated, non-negotiable system. Time tracking provides the volume of labor. Direct labor allocation provides the true cost of that labor. QBO Projects is the engine that multiplies volume by cost and subtracts it from project revenue to reveal true profit. Without all three working in concert, you are flying blind. This integrated system is the foundation of a financially mature and scalable agency.
From Data to Decisions: How to Read the Financial Story Your Numbers Are Telling
With this new, accurate data flowing through your system, you can finally move from guessing to knowing. The numbers in your reports tell a story about your agency’s efficiency and profitability. Your job is to learn how to read it. There are two key metrics you need to master: your Billable Utilization Rate and your Profit Margins.
Are You Efficient? Understanding Your Billable Utilization Rate
Your Billable Utilization Rate is the single best metric for understanding your team’s operational efficiency. It measures what percentage of your team’s available time is spent on revenue-generating client work. For the fundamentals, you can also refer to our guide to key financial roles in agency operations.
The formula is simple: Utilization Rate = (Total Billable Hours/Total Available Hours) x 100
“Available Hours” is typically 40 hours per week per employee. It’s crucial to understand that 100% utilization is not the goal; it’s a direct path to burnout. A healthy agency needs non-billable time for internal meetings, training, and business development. Therefore, target utilization rates must be set by role, reflecting the different responsibilities of each position.
| Role | Target Utilization Rate | Rationale |
|---|---|---|
| Designers, Developers, Writers (Doers) | 75% – 85% | The majority of their time should be dedicated to direct client work and deliverables. |
| Project / Account Managers | 60% – 75% | Their role requires a balance of billable client work with non-billable internal coordination, planning, and client communication. |
| Strategists / Senior Leadership | 30% – 50% | A significant portion of their time must be reserved for non-billable strategic work, including team management, process improvement, and business development. |
| Agency Owners / Executives | 10% – 30% | Their primary focus is on running and growing the business, not on direct service delivery. |
By tracking utilization against these benchmarks, you can quickly spot problems. A design team consistently below 75% might indicate a weak sales pipeline or poor project scheduling. An account manager pushing 90% is a red flag for being overworked and at risk of burnout.
Are You Profitable? Decoding Your Gross and Net Profit Margins
While utilization measures efficiency, profit margins measure financial health. For an agency, there are two margins that matter most:
- Gross Margin: This metric shows the profitability of your service delivery before accounting for your general overhead (like rent, administrative salaries, and marketing). It answers the question: “Are we pricing our services correctly and delivering them efficiently?” A healthy benchmark for an agency is a Gross Margin of 50-60% or higher . Your QBO Project Profitability report is the perfect tool to measure this on a per-project basis.
- Net Profit Margin (or Operating Margin): This is your true bottom line. It measures the profitability of the entire agency after all costs—both direct delivery costs and overhead—have been paid. It answers the question: “Is the business as a whole financially sustainable?” For a healthy agency in the $1M–$5M revenue range, a Net Profit Margin of 15-25% is a strong target. This number is found at the bottom of your main P&L statement in QBO.
If your Delivery Margin is healthy but your Net Profit Margin is low, it’s a clear sign that your overhead is too high for your current revenue level. If both margins are low, it points to a more fundamental problem with pricing or delivery efficiency.
The Path to Control: Introducing AURA’s No-BS Profit Audit
We’ve covered a lot of ground. The core takeaway is this: untracked administrative time is a real, quantifiable threat to your agency’s financial stability. But it is not an unsolvable problem. By implementing an integrated system of disciplined time tracking, leveraging the power of QBO Projects, and applying the truth metric of fully burdened labor costs, you can gain complete visibility and control over your profitability.
We understand that implementing this system while also running your agency can feel overwhelming. That’s why we created AURA’s No-BS Profit Audit.
This isn’t just a report; it’s a hands-on, collaborative partnership designed to give the insights into your agency’s overall financial health and scalability:
- Review the Data: We get temporary access into your financial and time tracking data. Pulling the necessary reports and information needed to analyze your agency’s performance.
- Analyze the Data: We guide you through running the initial reports, benchmarking your agency’s current utilization and profitability against industry standards, and identifying the biggest and most immediate opportunities for improvement.
- Develop an Action Plan: Together, we pinpoint the primary sources of time leakage and process inefficiency in your agency. We then do a 90 day EBITDA lift roadmap to plug those leaks, optimize your workflows, and improve your margins.
The goal isn’t just to find problems; it’s to build a more resilient, scalable, and predictably profitable agency. Gaining control over your time is the first and most critical step on that journey. AURA is here to be your strategic partner, helping you take that step with clarity, confidence, and control.

Supporting Resources
- ( https://www.workamajig.com/blog/scalable-growth )
- ( https://c2fo.com/resources/cash-flow-management/cash-flow-management-5-strategies-for-service-companies/ )
- ( https://www.indinero.com/blog/when-to-hire-a-fractional-cfo/ )
Citations
- Magnetic.app. “Agency Profitability Playbook 2025.”
https://www.magnetic.app/blog/agency-profitability-playbook-2025 - Planarty. “What Are Billable Hours and How Do They Impact Profitability?”
https://www.planarty.com/blog/what-are-billable-hours/ - Function Point. “Agency Utilization Rate: How to Calculate and Improve It.”
https://functionpoint.com/blog/agency-utilization-rate-how-to-calculate-and-improve-it - Firm of the Future. “Help project-based clients work smarter with these two QuickBooks Online enhancements.”
https://www.firmofthefuture.com/accounting/help-project-based-clients-work-smarter-with-these-two-quickbooks-online-enhancements/ - GrowthForce. “Two Ways to Do Labor Cost Allocation.”
https://www.growthforce.com/blog/two-ways-to-do-labor-cost-allocation